So much for staying ‘data dependent’. While central bankers are sticking to the line that they will be guided by the incoming data, the reality is that recent data releases have been a mixed bag which can be spun in various ways to tell different stories about the health of the economy.
On the one hand, business surveys have softened over the past few months, firms are reporting fewer new orders, and there is now clear evidence that labour markets are cooling. On the other, the hard activity data are – with one or two exceptions – holding up, wage growth remains robust and consumers are spending.
Which version should we – and, most importantly, central bankers – believe? Here’s our take.
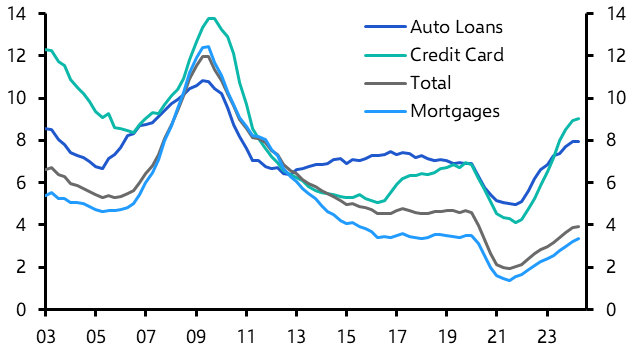
First, the US consumer remains key to the health of the broader global economy – and most of the evidence suggests that consumer spending in America remains robust. Not only did the July data show another healthy increase in spending, but the continued strength of imports within the trade data is a further sign of consumer strength. Admittedly, delinquency rates have continued to rise, particularly on floating rate debt such as credit cards. (See Chart 1.) This warrants close monitoring. But there is so far no sign it is starting to bleed into broader weakness in household spending.
|
Chart 1: US Delinquency Rates (%) |
|
|
| Sources: LSEG Data & Analytics, Capital Economics |
Second, manufacturers in Europe are struggling but there is not much evidence of a recession in global manufacturing more generally. Data released over the past week showed that German industrial production fell by 2.4% m/m in July, and French production dropped 0.5% m/m in the same month. We expect data published this week to show that industrial output in the euro-zone as a whole contracted by over 2% m/m in July. This would leave it more than 4% lower than the same month in 2023.
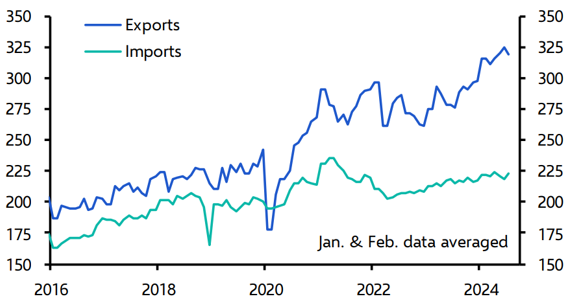
But weakness in euro-zone manufacturing, particularly in Germany, reflects structural as well as cyclical factors. Industry elsewhere in the world looks to be holding up better (weakness in recent US manufacturing data was due in part to extended retooling shutdowns at auto producers which should be reversed in the coming months.) In Asia, manufacturing output remains strong, with goods export volumes from China close to record highs. (See Chart 2.) Accordingly, while industrial weakness in Europe is real, this does not reflect border global weakness in manufacturing.
|
Chart 2: China Goods Trade ($bn, seasonally adjusted, 2021 prices) |
|
|
|
Sources: CEIC, Capital Economics |
Third, labour markets are cooling, but not cracking. In the event, August’s US employment report did not live up to its billing as the final critical piece of data ahead of September's FOMC meeting. Payroll employment increased by a modest 142,000 and gains in June and July were revised lower. Set against this, the unemployment rate edged down from 4.3% to 4.2%.
In truth, too much attention is paid to monthly swings in payrolls employment. The payrolls series is volatile and, as the latest report demonstrated, prone to revision. Broader evidence suggests the US labour market is cooling, but not collapsing. Job vacancies are down, the quits rate has fallen and hiring intentions have softened. But aside from a spike in job cuts in August seen in the Challenger report, there is not much evidence that firms are actually laying off workers.
Labour markets elsewhere remain tighter than in the US. This is particularly true in Europe. One explanation may be that immigration has boosted labour supply to a greater extent in the US than in Europe. As a result, while central bankers in America are more concerned about labour markets cooling too rapidly, policymakers in Europe still have lingering concerns about the tightness of the labour market.
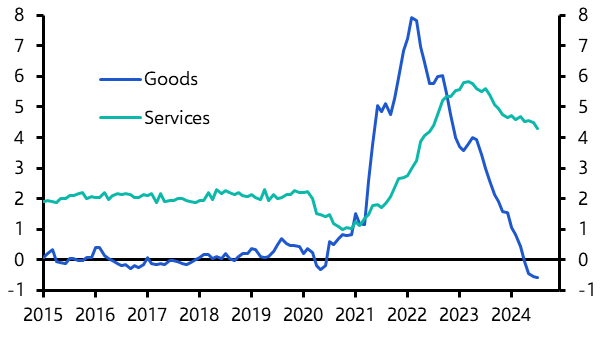
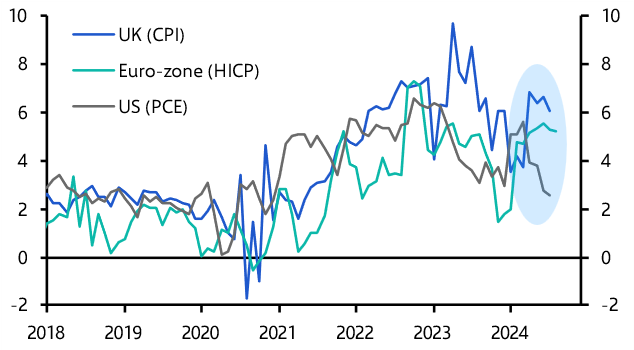
Finally, while inflation is now showing clearer signs of having normalised at 2.0-2.5% in the US, underlying price pressures remain stronger in Europe. The pick-up in headline inflation in the UK and Germany in July was driven by a rise in energy prices rather than domestic price pressures. But the bigger concern for central banks is the continued strength of services inflation. As Chart 3 shows, while goods inflation has continued to fall across advanced economies, services inflation remains elevated. It is important to stress that services inflation doesn’t need to fall to 2% for headline inflation to be consistent with central banks’ 2% inflation targets – goods inflation tends to run below 2%, meaning services inflation can run at higher rates while still keeping headline inflation at 2%.
|
Chart 3: Core CPI Goods and Services Inflation (Advanced Economies, %) |
|
|
| Sources: LSEG Data & Analytics, Capital Economics |
The major concern in the euro-zone and the UK is that when viewed on a 3m/3m basis, services inflation has started to rise again. (See Chart 5.) This stands in stark contrast to the US. Some temporary factors, including the Paris Olympics, Taylor Swift tour and the expiry of public transport discounts in Germany have played a role. But the rebound in services inflation may also reflect the relative tightness of European labour markets. This puts central banks in the region in a much tougher spot.
|
Chart 4: Core CPI Service Inflation (3m annualised) |
|
|
| Sources: LSEG Data & Analytics, Capital Economics |
What does all this mean for central banks and the setting of monetary policy? A collapse in the retail sales and industrial production data for August, due next week, could yet result in the Fed kick-starting its easing cycle with a 50bps cut in interest rates at its September meeting, but our sense is that the balance of probability remains tilted towards a 25bps reduction. Either way, there is now a clear case for dialling back the restrictiveness of policy in the US. We expect the Fed to ease at every meeting this year (with 25bps cuts in November and December) and to lower the Fed Funds rate to 3.25-3.50% by the end of 2025.
In contrast, the lingering strength of services inflation means that central banks in Europe will ease at a slower pace. The European Central Bank, which started easing policy in July, will cut rates by 25bps once a quarter through to the end of 2025. This includes a 25bps cut at its meeting this week. We don’t think the Bank of England will follow up on its August rate cut with another move at its September meeting, but we do expect cuts when it meets in both November and December.
Inflection points in monetary policy cycles are always hard for both policymakers and market participants to judge. This one has been made still harder by the unusual nature of the cycle itself and by the distortions created by the pandemic. In turn, the absence of a clear framework for understanding what has been driving inflation has reduced central banks to this state of ‘data dependence’.
The problem with this approach is how to calibrate policy – and portfolios – when that data are telling contrasting stories. Moreover, when much of the data is coincident at best, and lagging at worst, there is a clear risk that central banks keep policy too tight for too long. It’s an issue we’re planning to address with an upcoming report and interactive dashboard which provide a tool for clients to identify where recession signals are flashing most within advanced economies. Drop me an email if you would like to see it.
In case you missed it
Following on from her recent work on global imbalances and fracturing, Senior Global Economist Ariane Curtis explored how rising tariffs on green technologies and semiconductors will shape the global macro picture.
Diana Iovanel from our Markets team showed why moves in stocks and bonds following reaction to that US August employment report looked overdone.