The President is calling it “Liberation Day”, but nobody knows exactly what the White House will come up with when the long-awaited reciprocal tariffs plan is finally unveiled on 2nd April – including, it seems, the administration itself.
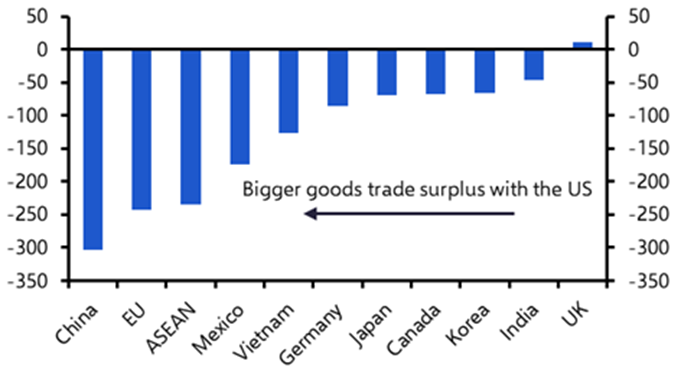
Initial reporting suggested the focus would be on the so-called “Dirty 15” of countries with which the US runs its largest trade deficits. That includes China, Mexico, Germany (and by extension, the EU), Japan, South Korea, Taiwan, and Vietnam. (See Chart 1. Clients can access and download data via our Trade War dashboard.)
|
Chart 1: Bilateral Goods Trade Deficits with the US ($bn, 2023) |
|
|
|
Sources: LSEG, Capital Economics |
But the narrative won’t stop shifting. After announcing sweeping tariffs on autos and auto parts last week, President Trump suggested that further sector-specific tariffs are coming, with pharmaceuticals and lumber seemingly next in line, but also that reciprocal tariffs on individual countries could be more modest than initially feared. This approach would appear to blend large tariffs on certain goods with smaller tariffs on particular countries.
However, subsequent reports over the weekend have suggested that large country-level tariffs are still on the table. What this will all amount to in practice is anyone’s guess.
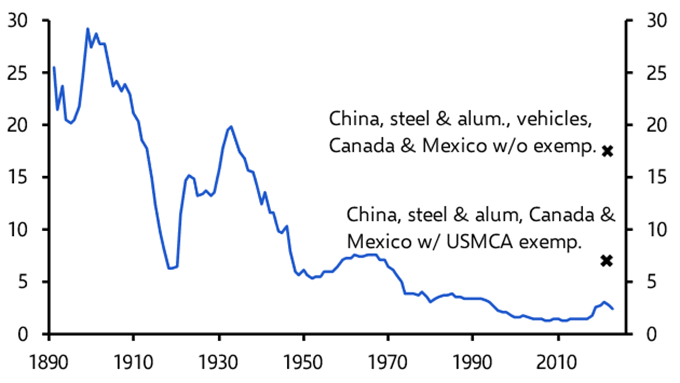
What is known is that additional 20% of tariffs imposed on China so far, the partial 25% tariffs on Canada and Mexico as well as the 25% tariffs on steel and aluminium have already pushed the effective US tariff rate up toward 7%. After including motor vehicle tariffs and the scheduled broadening of tariffs on Canada and Mexico this week, it could be as high as 18% even before we consider the announcements due this week. Either way, it seems almost certain that the tariff rate will soon be the highest since the 1940s. (See Chart 2.)
|
Chart 2 : Average Tariff Rate (% of total imports) |
|
|
|
Sources: LSEG, Capital Economics |
Tariffs are not costless
This will have clear – and clearly negative – economic consequences. Although Trump continues to insist that tariffs are a tax on US trading partners, it is American importers who must foot the bill, with the costs typically passed on to consumers. Chart 3 illustrates the effect of different tariff scenarios on the average US tariff rate and PCE prices, whose index is the Federal Reserve’s favoured inflation gauge.
|
Chart 3: How Different Tariff Scenarios affect the Average US Tariff Rate & US PCE Deflator |
|
|
| Sources: LSEG, Capital Economics |
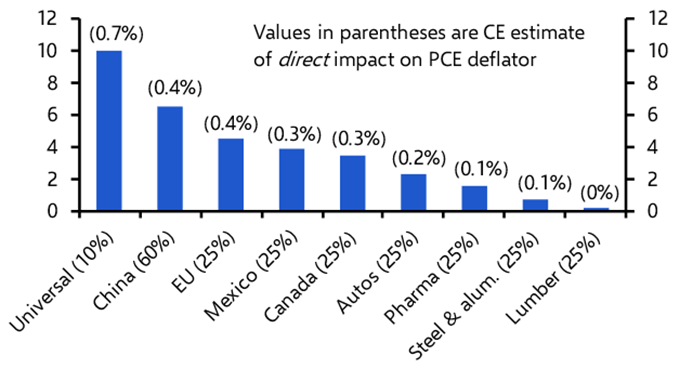
Our assumption since election day has been that the average tariff rate on US imports from China will increase to 60% while that on other countries will increase by 10%-points on average, in line with the implications of a universal tariff. Despite the administration’s on-again, off-again approach of recent weeks, this remains a reasonable base-case – though risks are tilted to the upside. Those two assumed tariff rates would get the effective US tariff rate to 18% and see PCE prices rise by a little more than 1%, pushing PCE inflation to more than 3.5% y/y by the end of this year. While this would represent a one-off shift in the price level, rather than a sustained increase in inflation, it would nonetheless leave the Fed in a bind. The market is still pricing in between two and three 25-basis-point cuts to the fed funds rate this year but, on the assumption that the US economy cools but doesn’t collapse, we think rising inflation will mean Fed officials leave rates on hold throughout 2025 and wait until next year before starting to ease policy again.
Looking beyond the US
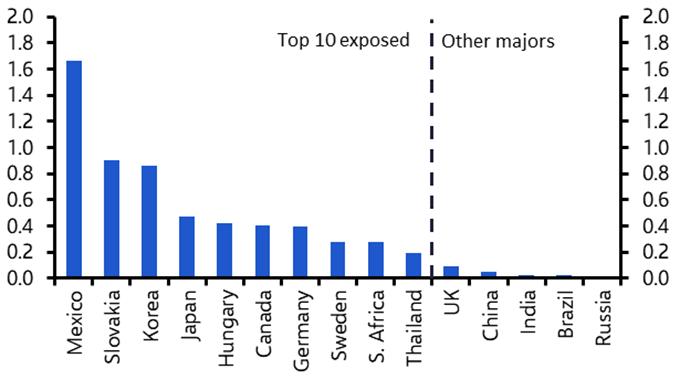
The impact on other countries is harder to assess, since this requires taking into account the effects of reciprocal tariffs and the exposure to sector-specific levies. Mexico is most vulnerable to the auto tariffs announced last week, although if exemptions for parts compliant with the United States-Mexico-Canada trading agreement remain in place, this should lessen the impact. The next most exposed countries are Slovakia, Korea and Japan. (See Chart 4.)
|
Chart 4: Domestic Value Added Dependent on US Demand for Vehicles & Parts (% of own country GDP, 2024 est.) |
|
|
|
Sources: ITC, OECD, LSEG, White House, Capital Economics |
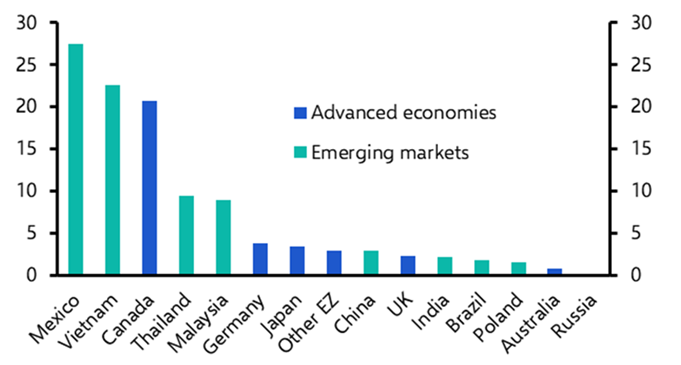
A country’s exposure to reciprocal tariffs depends on the level of the tariffs and the reliance of that country on exports to the US. Chart 5 shows that Mexico, Canada, and Vietnam are the most exposed, given the high share of their GDP tied to US trade. The anticipated effect of higher US tariffs is the key reason why we expect Canada to slide into recession this year and Mexico’s economy to flat-line. If anything, the risks to these forecasts lie on the downside.
In contrast, exports to the US account for only around 2-3% of GDP in China, Japan and the euro-zone. Tariffs are still a headwind for these economies, but they are not as concerning as they are for the likes of Mexico and Canada (Vietnam could end up a net beneficiary if more production shifts to skirt tariffs on China.) As a broad rule of thumb, a 10% tariff on all imports from the euro-zone would probably shave only 0.1-0.2 percentage points off regional GDP. One critical question will be how sector-specific tariffs interact with country-level reciprocal tariffs. If they “stack up” then the effects – both on the US and other economies – will compound. The response of other countries will also be important. So far, responses have been calibrated so as not to significantly escalate tensions with the US.
|
Chart 5: Goods Exports to the US (% of home country GDP, 2023) |
|
|
|
Sources: LSEG, Capital Economics |
The end game
Running through all of this is the critical question of whether these tariffs are permanent or intended as bargaining chips in future negotiations. The Trump administration’s motivations appear to be threefold: reducing the trade deficit (which is a flawed economic rationale), extracting concessions from trading partners, and revenue generation. The relative weight of these objectives may become clearer from the implementation of these tariffs, and the extent to which some countries are hit harder than others.
If the administration invokes emergency powers to impose reciprocal tariffs, while simultaneously launching longer-term investigations into trading practices, it could suggest an attempt to lay the legal groundwork for tariffs to remain in place for an extended period. That would signal a lasting shift in US trade and fiscal policy, with tariffs viewed primarily as a tool to raise permanent sources of revenue for the federal government. Conversely, if some countries, notably China, are hit harder by reciprocal tariffs than others, then it could suggest a more concerted effort to level the playing field for US exporters and push back against geopolitical adversaries.
In practice, we expect it will be a bit of both: tariffs will likely remain in place for some time but will also be raised more aggressively on China than other trading partners. To this end, they would represent both a shift in US revenue mix but also represent a new front in global fracturing.
Tariff wars have no real winners – only mounting costs and unintended consequences.
In case you missed it
We’ll be briefing clients about the “Liberation Day” announcements in online Drop-In briefings on Thursday, 3rd April at 0900 BST/1600 SGT and at 0800 ET/1300 BST. More tariffs-related briefings could be scheduled depending on what the White House announces this week – check your inbox for details of the latest events or bookmark our events page.
After a tough week – and quarter – for the S&P 500, see Chief Markets Economist John Higgins’ recent analysis exploring the relationship between bear markets and US recessions.
Copper prices have hit record highs this year but our Commodities team is warning of the metal’s weak supply-demand fundamentals and reiterating our below-consensus end-year forecasts. (Our Metals Tariff Impact Tracker is an interactive guide to the intersection between US trade policy and industrial metals markets).