The next moves in interest rates are starting to become clearer. In the US, the incoming data continue to paint a picture of an economy that remains relatively resilient and suggest that, having kickstarted its easing cycle with a 50-basis point (bps) cut in interest rates last month, the Federal Reserve will revert to a more conventional 25bps cut when they meet next month. Meanwhile, in Europe, several members of the European Central Bank’s Governing Council have telegraphed a 25bps cut at this week’s meeting. With the economic data softening and inflation set to stay close to the ECB’s 2% target we expect another 25bps cut at its meeting in December. But the destination is often more important than the journey. Where will interest rates end up in this cycle?
A question of R*
At the core of this question sits the issue of what has happened to equilibrium real interest rates, or R*. This is the (real) interest rate that balances planned investment and desired saving in an economy at full employment. Accordingly, it provides an anchor for forecasts of where interest rates might be heading over the medium term. However, while R* is a useful analytical concept it is impossible to observe, at least in real time. It is therefore the subject of much debate and angst among economists and policymakers.
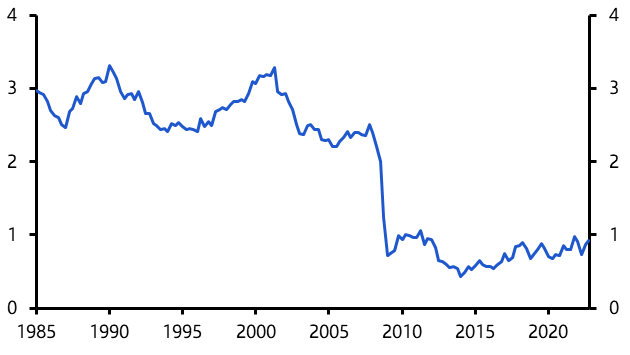
Most agree that the three decades prior to the pandemic were characterised by a marked decline in R*. According to estimates by the New York Fed, equilibrium real interest rates in advanced economies averaged around 3% in the 1990s. But several structural forces, including a slowdown in potential economic growth and a large cohort of workers saving for retirement, started to bear down on real rates throughout the 2000s. And the process of balance sheet repair that followed the Global Financial Crisis then put further downward pressure on R* in the 2010s, leaving it just above 0.5% by the middle of that decade. (See Chart 1.) With inflation persistently undershooting targets across advanced economies, this left nominal interest rates close to the zero lower bound.
|
Chart 1: R* in Advanced Economies (%, Average of US, Canada, and Euro-zone) |
|
|
|
Source: Holston, Laubach, and Williams (2023, Updated Estimates) |
Where does R* sit now? Some argue that since neutral rates are inherently unobservable then trying to estimate them is a pointless task. But this swerves a critically important question. Fed Chair Powell has likened setting monetary policy to navigating by the stars under cloudy skies. As forecasters, it is our job to provide some visibility.
We tackled the subject of R* in a major report last year. The key conclusions still stand today, with the most important being that the level of neutral interest rates is likely to have increased compared to the pre-pandemic period.
This is partly because many of the forces that suppressed R* in the 2010s have faded. Most obviously, the process of deleveraging and balance sheet repair that followed the GFC has run its course. But higher fiscal deficits and increased investment demand have also added to upward pressure on R*. As a result, we think that the (real) neutral interest rate in the US is now around 1.0% or so. Neutral real rates in the UK and euro-zone are likely to be a bit lower – perhaps 0.75-1.00% in the UK and about 0.5% in the euro-zone. These estimates are hedged with uncertainty but they give a sense of the order of magnitude of the shift in R*.
A step change in inflation?
The next question to tackle is whether there has been a step-change in inflation following the price shocks of the past few years. Our sense is that the days of persistent undershoots of inflation relative to central bank targets are behind us and that inflation overshoots will become more common. But this doesn’t amount to a major shift in long-run inflation dynamics. We expect CPI inflation to average 2.0-2.5% a year in advanced economies over the next decade (compared to an average of 1.5% between 2010 and 2020).
If we combine our estimates of R* with our forecasts for trend inflation then we start to get a sense of where nominal interest rates might be heading in the soft landing scenario that we are forecasting (i.e. one in which there is no significant cyclical demand weakness that requires policy to be accommodative).
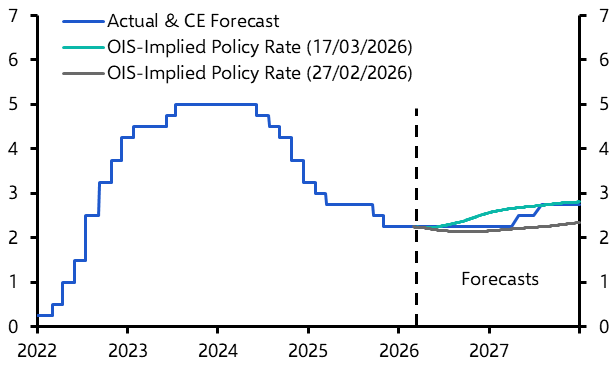
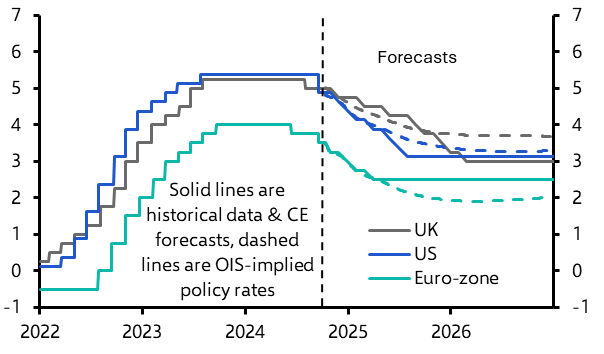
This would put the nominal interest rate at around 3.00-3.25% in the US, 3.00% in the UK and 2.5% in the euro-zone. It is of course possible to pick holes in these numbers. But this does at least provide a framework for thinking through where interest rates are heading and how we should set our forecasts. Given our macro forecasts, we think that in this cycle interest rates will trough at these levels in the US, UK and euro-zone. (See Chart 2.) This would be well above the lows seen in the past two rate-cutting cycles. And, our report sets out, there are good reasons to think that interest rates will trend higher over the next cycle too.
|
Chart 2: Policy Interest Rates (%) |
|
|
| Sources: LSEG Data & Analysis, Capital Economics |
The skies may be cloudy but experience and analysis provides some confidence about where the stars are located.
In case you missed it:
- Julian Evans-Pritchard gives a first take on this weekend’s press conference by China’s Ministry of Finance.
- With US 10-year Treasury yields now back to our end-year target of 4%, James Reilly assesses what will come next.
- Our US team argues that Hurricane Milton adds to the upside risks to near-term inflation.