The US president’s approach to trade policy may be – putting it charitably – inconsistent, but Donald Trump has at least been consistent in how he views the US balance of payments.
As far back as the late 1980s, Trump was publicly complaining about how its trading partners were taking advantage of the US and fuelling its gaping trade deficit (telling Playboy in 1990, for example, that “our “allies” are making billions screwing us”.)
This consistent griping about the state of US trading relations reflects the mind of someone who views the balance of payments the same way as he does a company balance sheet. Through this lens, deficits equate to losses and are therefore “bad”, while surpluses are profits and so are “good”. This helps explain the president’s obsession with narrowing the trade deficit, and his corresponding justification for tariff hikes and push for a weaker dollar.
At the risk of stating the obvious, the US economy isn’t a real estate firm and shouldn’t be viewed the same way. There is no link between the trade balance (or more accurately, the current account balance) and economic prosperity. Deficits do not represent “losses” that make countries worse off – in fact, in many cases, they reflect strong consumer demand.
The real reason to worry about external deficits
But there is a truth in the idea that large external deficits represent a challenge to be addressed – just not for the reason that President Trump believes. The US current account deficit has not been responsible for the loss of manufacturing jobs, nor does it mean that other countries are, in Trump’s words, “taking advantage of America”.
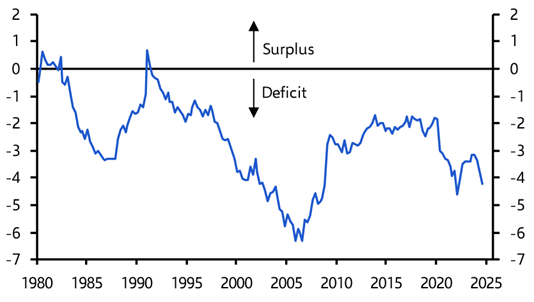
The concern instead stems from both the size of America’s current account deficit (which is now running at just over 4% of GDP) and also its persistence. The last time the US ran a surplus on its current account was nearly 35 years ago. (See Chart 1.)
|
Chart 1: US Current Account Balance (% of GDP) |
|
|
|
Sources: LSEG Analytics, Capital Economics. |
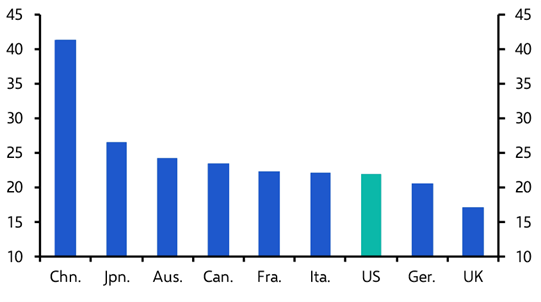
The counterpart to sustained current account deficits has been that the US has accumulated a large amount of external liabilities. And while this would not necessarily be a concern if external borrowing had been used to finance investment that could generate a stream of income, it is difficult to argue that this has been the case in the US. Investment as a share of GDP remains relatively low. (See Chart 2.)
|
Chart 2: Investment (% of GDP, 2024) |
|
|
|
Sources: IMF, Capital Economics. |
Large and sustained current account deficits – and the associated accumulation of external liabilities – have therefore left the US dependent on maintaining the confidence of foreign investors. (This is what Mark Carney, during his time as the Governor of the Bank of England, referred to as the “kindness of strangers”.) The US is helped in this regard by the fact that it has the world’s reserve currency, which creates ready demand for dollar-denominated assets. But this does not give the US licence to run large external deficits indefinitely. America’s net international investment position (i.e. its foreign assets minus foreign liabilities) now stands at nearly -80% of GDP. And whereas the US used to generate a higher return on its overseas assets than it paid out on its liabilities to foreigners, those days are over. It now runs a deficit on the investment income balance of its current account, adding to its deficit on trade. The steady deterioration in America’s balance of payments deficit is a ticking time bomb under its economy – but also under global financial markets.
A framework for thinking
So what is to be done? The starting point is to recognise that a) while the current account balance matters, it isn’t the only economic metric that policymakers must pay attention to; and b) that it is influenced by several factors. Crucially, since trade must balance at a global level, every deficit must be offset by a surplus somewhere else. The two key players in this are the US (which runs the largest current deficit in dollar terms) and China (which runs the largest current account surplus).
One framework for thinking through how to narrow these imbalances is provided by a simple model developed by Trevor Swan, an Australian economist working after the Second World War. Swan argued that the concept of ‘economic balance’ had two elements. The first is ‘internal balance’ – that is to say, a state of low domestic inflation and full unemployment. The second is ‘external balance’ – or equilibrium in the current account.
In Swan’s model, there are various combinations of the real exchange rate and domestic demand at which internal balance can be achieved. When domestic demand falls, a weaker real exchange rate is needed to boost exports and maintain full employment. Likewise, when domestic demand picks up, a stronger real exchange rate is needed to choke off demand and prevent inflation from accelerating.
In addition, there are a number of combinations of the real exchange rate and domestic demand at which external balance can be achieved. When domestic demand is strong, a weaker real exchange rate is needed to boost exports and offset the subsequent increase in imports. Conversely, when domestic demand is weak, a stronger real exchange rate is needed to keep the current account from swinging into surplus.
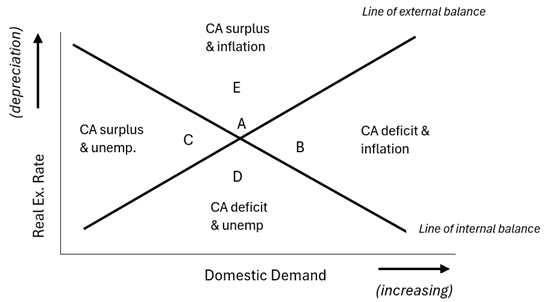
The upward sloping line in Chart 3 shows the various combinations of domestic demand and the real exchange rate at which external balance is achieved. Likewise, the downward sloping line shows the various combinations at which internal balance is achieved. Crucially, however, there is only one point at which both internal and external balance is achieved (point A). At all other combinations, macroeconomic imbalances result.
|
Chart 3: Swan Diagram |
|
|
|
Sources: Capital Economics. |
Enter the dragon (and the bald eagle)
How does this apply to the world’s two largest economies today? The US runs a large current account deficit and inflation is currently a bigger concern than unemployment. This puts it somewhere around point B in the diagram above. In contrast, China runs a large current account surplus and, while there are few signs of widespread unemployment, deflation is a bigger concern than inflation. (The real issue is weakness in consumer spending stemming from structural flaws in China’s growth model.) This puts it somewhere around point C. In policy terms, the US needs weaker domestic demand to move it back to balance (i.e. point A) but the implications for the currency are ambiguous (since it depends where exactly in the quadrant the US sits). Meanwhile, stronger domestic demand is required to return China to internal and external balance, but the implications for the real exchange rate are also ambiguous.
This represents a significant shift from the period shortly after the Global Financial Crisis. Back then, the US ran a current account deficit while suffering high unemployment (point D), and China ran a surplus while its economy was showing signs of overheating (point E). The path back to balance involved a weaker (real) dollar for the US and a stronger (real) renminbi for China.
The Swan diagram is a deliberately stylised model. But its appeal lies in its simplicity and its ability to identify what’s required to moderate macroeconomic imbalances.
In the case of the US, it suggests the answer doesn’t lie in a ‘Mar-a-Lago Accord’ to realign exchange rates. Likewise, a strong renminbi won’t necessarily rebalance China’s economy. Instead, what is needed is a coordinated attempt to expand domestic demand in China and squeeze domestic demand in the US.
Given the size of the federal government deficit and debt burden, a demand squeeze in the US would ideally take place through fiscal retrenchment. The expansion of demand in China would suck in exports from the US, thus keeping America at full employment while efforts are made to put its public finances on a more sustainable footing. At the same time, an expansion of Chinese demand would reinvigorate its consumers and reduce the country’s current account surplus. All of this would result in a more balanced (and more stable) US economy, Chinese economy and thus global economy.
Unfortunately, the reticence of policymakers in China to expand fiscal support and eagerness of US policymakers to cut taxes – not to mention the more fundamental challenges of policy coordination between Beijing and Washington – mean the chances of this actually happening are somewhere close to zero.
But the Swan Diagram’s essential insight is that any ‘grand bargain’ to resolve global imbalances that focuses solely on currency realignment would be unlikely to bear much fruit.
In case you missed it:
Ahead of the Bank of England’s policy meeting on Thursday, see our interactive MPC Monitor for an at-a-glance guide to the appetite of MPC members to cut rates – it’s why we think this week’s vote will be ‘misleadingly dovish’.
How sustainable are Javier Milei’s efforts to turn around the Argentine economy? It’s one of the most frequently asked questions of our EM team, which argued last month that currency reforms will be key. Learn more about what’s still needed and get answers to your questions about Milei’s progress in our Drop-In on Wednesday, 19th March.