- Following on from our recent background note on the EU’s Carbon Border Adjustment Mechanism (CBAM) and the signing off on the tool by EU Ministers over the weekend, this Update examines which countries may be most affected by the eventual introduction of the tax.
- The obvious place to start is to look at which countries export the most goods to the EU that will be covered by the CBAM when it eventually comes into force. To re-cap, these goods are iron and steel, cement, fertilisers, aluminium, and electricity and hydrogen. The 20 largest exporters of CBAM goods to the EU are shown in Table 1, with the absolute value of exports in 2021 shown in column A.[1]
- However, a better way of looking at the impact that CBAM could have on countries is to measure the value of each country’s CBAM exports to the EU as a) a share of its total goods exports and b) a share of its total exports of goods covered under the CBAM. (See columns B and C in Table 1.) For example, exports of goods covered by CBAM to the EU account for more than half of the UK’s exports of such goods but only about 1.5% of total UK goods exports. (See bottom row of Table 1.)
- Moreover, the likelihood of a country’s CBAM exports to the EU being affected by the CBAM is also a function of a) how “dirty” a country’s power sector is, proxied in column D by the importance of coal in each country’s energy mix, and; b) whether the production of the CBAM goods overseas is already subject to a carbon pricing mechanism, and at what price (columns E and F). We use this suite of metrics to rank countries’ exposures to the CBAM in Table 1; the higher up the table a country is, the more likely that its exports will fall foul of the CBAM. Four key points are worth making.
- First, the impact of CBAM will differ from country to country and will depend on price elasticities of demand and the availability of substitutes. For some goods, it may end up redirecting demand. But for less elastic/substitutable products, its impact would probably show up most clearly in higher EU import prices.
- Second, emerging markets are most likely to be affected. Bosnia and Herzegovina and Serbia are exposed on multiple fronts given the comparatively high shares of their goods exports that fall under the plan (mainly electricity) as well as their reliance on coal and lack of carbon pricing schemes. But South Africa, India, and Turkey are the most exposed of the major economies. (For obvious reasons following the war in Ukraine, trade flows between the EU and Russia/Ukraine may no longer be representative.)
- At the other end of the spectrum, developed markets are less likely to be directly affected. In fact, the UK will most probably be exempt given that coal’s share of primary energy in the UK is lower than in the EU (2.9% versus 11.2%) and also because the UK’s carbon price is at least comparable to the EU ETS.
- Third, it’s worth stressing that CBAM will not come into force until 2026 and a lot can change in the meantime. In particular, countries can reduce their exposure to the CBAM by cleaning up their power sectors and/or taxing carbon as heavily as in the EU. This will be a big draw for some countries, with Bosnia and Herzegovina and Serbia moving towards carbon pricing explicitly to try to side-step the CBAM.
- Finally, by keeping its options open to potentially offer rebates for EU-based manufacturers at some point, the EU has not dispelled accusations that the CBAM is designed to be protectionist. That said, similar claims can be made against the package of subsidies in the US’s Inflation Reduction Act. And in our view such considerations should not distract from the economically sound principle at the heart of the CBAM.
|
Table 1: Framework of Exposures to the EU’s Carbon Border Adjustment Mechanism (CBAM) |
|
|
|
Sources: UN Comtrade, BP, World Bank, Capital Economics |
|
*EU average = 11.2%; **As at 1st April 2022; EU ETS = $86.53; USA price = California ETS |
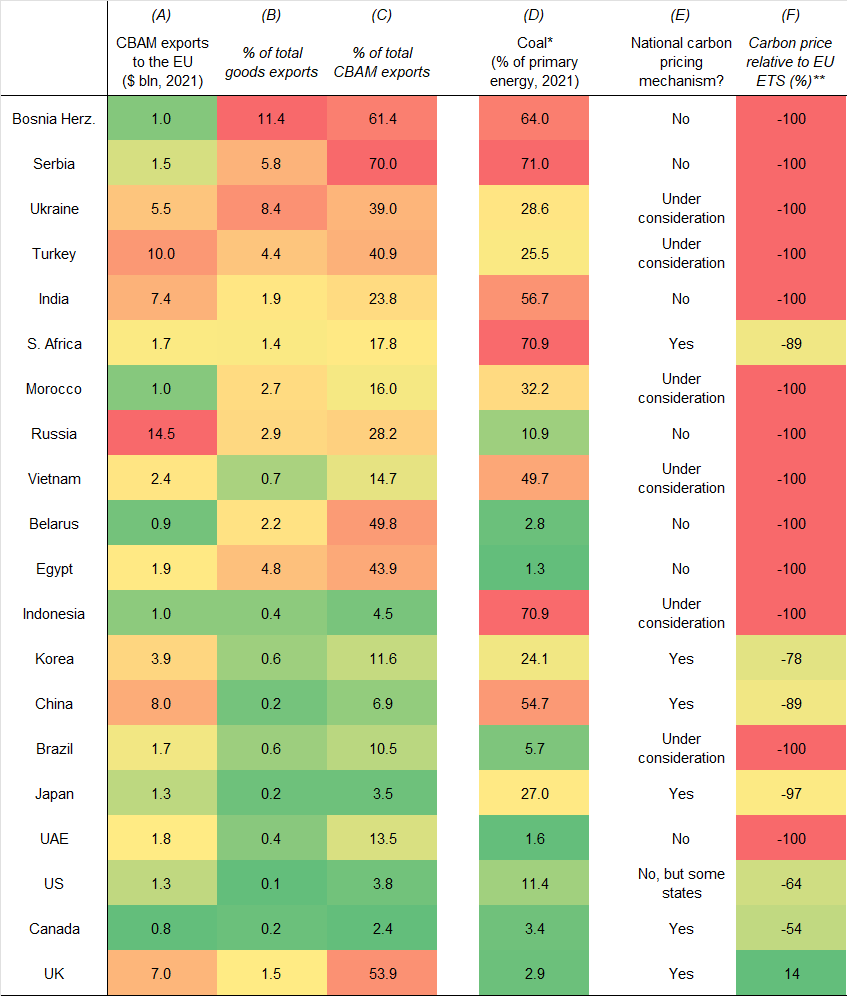
[1] Note that we’ve focused on a representative group of six HS trade codes in column A of Table 1 rather than the 30-odd precise ones included in Annex 1 of the EU’s July 2021 CBAM proposal. This is partly because the picture has changed a bit since (eg, hydrogen was added to the list during the “trilogue” negotiations between the European Commission, Council, and Parliament). But it is largely to preserve our time and sanity navigating the UN Comtrade database. Crucially, this will not affect the wider conclusions of this analysis. Also note that Table 1 excludes Norway and Switzerland as they are members of the European Free Trade Association and so their goods exports will be exempt from the CBAM.
David Oxley, Head of Climate Economics, david.oxley@capitaleconomics.com