
Spotlight 2024
The drivers of US macro and markets leadership
June 2024

The US economy and equity market have powered ahead of other countries since the pandemic. This primarily reflects demand-related factors that are largely temporary, as well as the strong performance of big tech. But there is a more fundamental issue of outperformance that predates the last few years.
For all its flaws, the US has long been a world-leading economy in a number of important respects. It has been an economic leader as the largest economy in the world since the late 1870s. While GDP growth has sometimes been faster elsewhere, none of its peers have persistently outperformed the US. And its GDP per capita has long been the highest of the world’s major economies. The US has also been a technological leader, at the forefront of historic advances in communication, transportation, space exploration and IT. And while China and other parts of Asia are now overtaking in some areas, the US is a leader in cutting-edge AI. The US has also been a financial leader given the dollar’s dominance and the size of its equity and bond markets. But economic outperformance has not always meant stock market outperformance - relative returns have been much more variable over history.
This analysis begins by unpicking the common perception of the US economy as an economic leader. What do we mean by outperformance? How has the US outperformed and to what extent? In the remaining part of this exclusive extract of our client report, we assess why this has happened.
Defining outperformance
Various terms are used to describe the US and its position as a global economic superpower: exceptionalism; pre-eminence; supremacy… but all of these concepts are a bit vague, and do not necessarily give an idea of the direction of travel.
Here, we will consider two types of economic leadership: “dominance”, which relates to the economy’s past and current standing in the world and “outperformance”, which is more about growth and progress. And we will assess the extent to which the US is leading in three key areas: the economy as defined narrowly in terms of GDP; technological progress; and financial markets. There are many other respects in which the US does not compare favourably to other economies. For example, its life expectancy and health outcomes are relatively poor, there is significant inequality and its progress towards international environmental goals has been slow. But our focus is on the economy, financial markets and forces that have a direct bearing on the two.
Economic/GDP leadership
When we think of US outperformance, our minds might reasonably turn to the post-pandemic period of extraordinary economic resilience despite the backdrop of aggressive monetary policy tightening. This is a sense in which the US has clearly “outperformed”. GDP growth in the US averaged 0.8% q/q in 2023, compared to 0.0% and -0.1% in the euro-zone and UK respectively. We have argued that recent US outperformance can be explained by four main factors: fiscal support; a high propensity to run down “excess savings”; a less severe energy crisis; and a pick-up in productivity as labour shortages prompted efficiency gains. (See here.) Most of these factors are temporary and cannot be expected to cause growth to outpace that elsewhere persistently in the longer term.
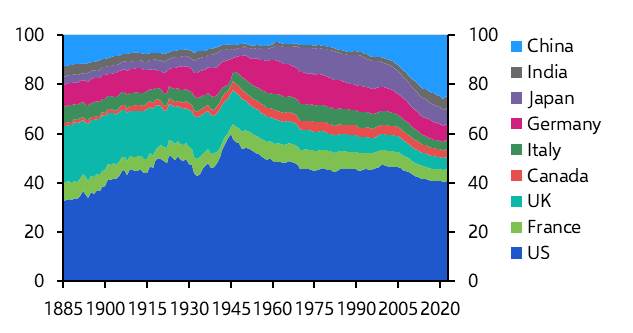
But there is a more fundamental issue of “dominance” that far predates the last few years. The US became the world’s largest economy in the mid-1870s, when it overtook China, India and the UK. It has clearly dominated the world economy throughout the modern era. (See Chart 1.1.)
|
Chart 1.1: Share of Real GDP among G7, China & India (2023 prices & market exchange rates) |
|
|
|
Source: Angus Maddison, IMF, Capital Economics |
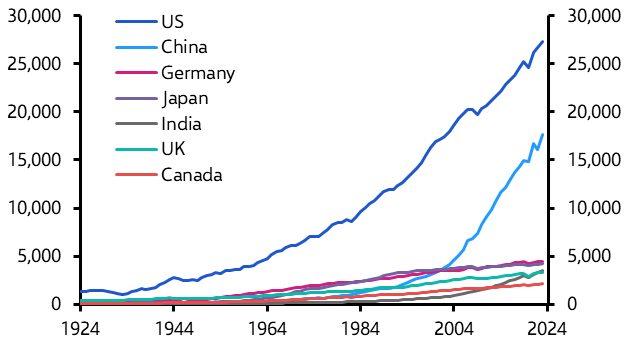
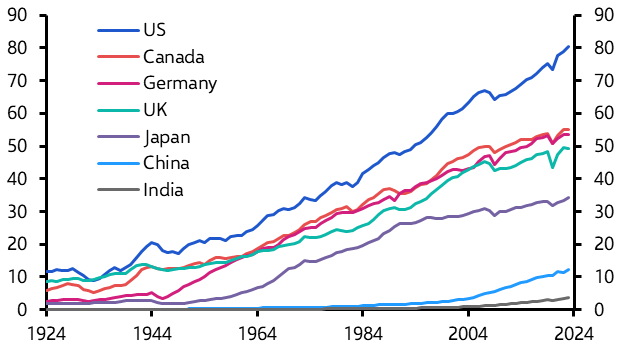
China has emerged as a challenger this century, and its rapid rise is clear in Chart 1.2. But when measured at 2023 prices and market exchange rates, its GDP is still only 65% that of the US. And no other major economy comes close in size.
|
Chart 1.2: Real GDP ($bn, 2023 market prices and exchange rates) |
|
|
|
Sources: Refinitiv, IMF, Maddison, Capital Economics |
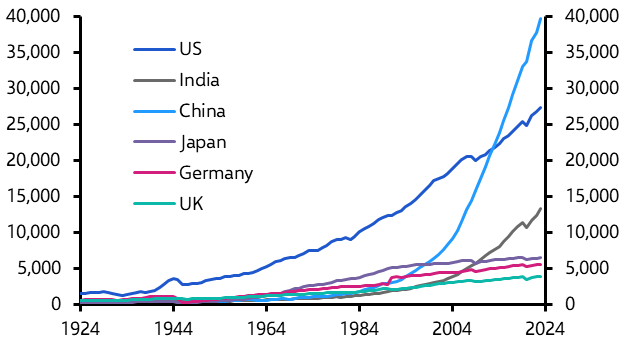
In our view, GDP at market exchange rates is the best way to think about economic dominance. This metric is best for understanding the global economic landscape from the perspective of which economies wield most power in terms of trading relationships, financial firepower and geopolitics. It’s also common to think about GDP in PPP terms; i.e., adjusted for differences in price levels in each economy to reflect the domestic purchasing power of GDP. On this metric, China overtook the US around the mid-2000s. (See Chart 1.3.) However, PPP adjustments are more relevant when thinking about relative living standards between countries rather than economic heft – and in any case GDP per capita in China is still around 30% of that of the US when measured at PPP exchange rates.
|
Chart 1.3: Real GDP (International $bn, 2023 PPP) |
|
|
|
Sources: Refinitiv, Capital Economics |
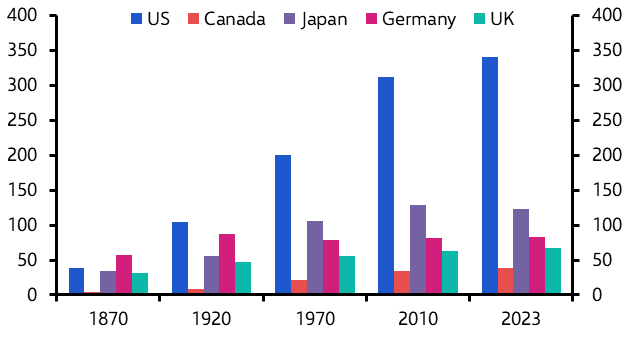
Much of the surge in US GDP relative to other economies has reflected strong population growth, especially between 1870 and 1950. While the US population (335m) has never overtaken that of India (1,410m) or China (1,415m), it is now five times the size of the UK. (See Chart 1.4.) What’s more, the US population is still growing faster than those of other G7 economies.
|
Chart 1.4: Population (millions) |
|
|
|
Sources: Refinitiv, Capital Economics |
However, the US is also a world leader in terms of GDP per capita. It has had the highest level of GDP per capita among the major economies since around 1900. (See Chart 1.5.) The only exceptions with higher GDP per capita (in market prices) are small economies with major financial centres like Singapore and Hong Kong or energy/commodity producers like Qatar and Norway. And in PPP terms, no other major economy comes close to the US in terms of GDP per capita (particularly not China).
|
Chart 1.5: Real GDP per Capita ($000s, 2023 market prices and exchange rates) |
|
|
|
Sources: Refinitiv, Capital Economics |
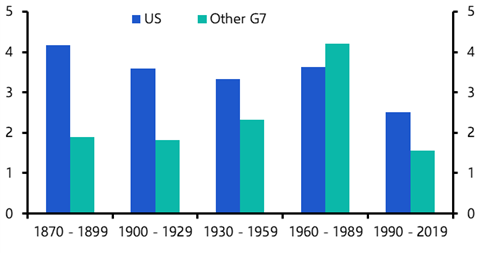
We can move on from “dominance” to “outperformance” by looking at the growth rates of GDP. The US has also consistently outperformed in this respect, particularly compared to the rest of the G7. (See Chart 1.6.) The period of underperformance between 1960 and 1989 mainly related to Japan’s “economic miracle”: a temporary period of rapid economic catch-up which was at its height in the 1960s and 1970s. Growth rates of GDP per capita have also typically been stronger in the US than in the rest of the G7.
|
Chart 1.6: Real GDP (% y/y, average over period) |
|
|
|
Sources: Refinitiv, Capital Economics |
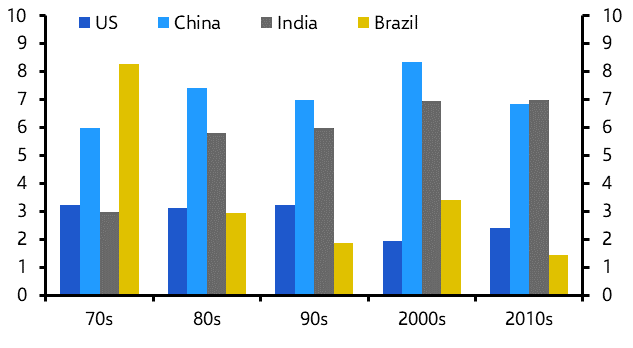
Of course, most emerging markets have achieved stronger growth than the US in the past 50 years. Chart 1.7 shows how China and India have outpaced US GDP growth by a wide margin, and the same can be said for most smaller emerging markets too.
|
Chart 1.7: Real GDP (% y/y, average over period) |
|
|
|
Sources: Refinitiv, Capital Economics |
Such rapid growth is common in earlier stages of development as economies catch up to the technological and income frontier. But while income levels remain so far below those in major advanced economies, these economies do not represent a real threat to US economic dominance.
The more interesting point is that the US has continued to outperform its advanced economy peers. Growth tends to be harder to achieve as economies mature and so it is impressive that the US is outgrowing the likes of Japan and most of the EU where incomes levels are still slightly lower. Of course, the same growth rate in the US generates more units of GDP than in any other economy since the US is so much larger. This has helped the US to maintain its position as the world’s biggest and richest economy over the decades.
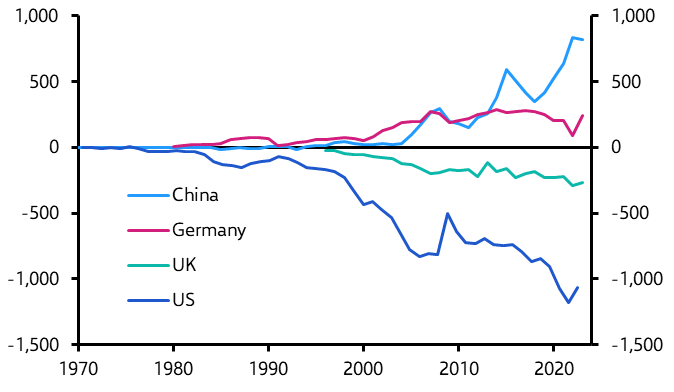
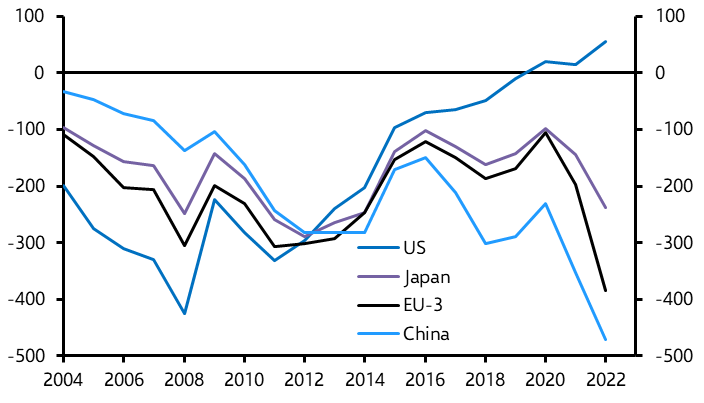
Admittedly, strong growth in the US has been accompanied by a build-up of external imbalances. The persistent strength of consumer spending – and a low domestic savings rate – has manifested itself in a large trade in goods deficit, which is now over $1 trillion per year (equivalent to 4% of GDP). This contrasts to the situation in China, where a high domestic savings rate has pushed the goods trade surplus to over $800bn or almost 5% of its GDP. (See Chart 1.8.)
|
Chart 1.8: Trade in Goods Balance ($bn) |
|
|
|
Sources: Refinitiv, Capital Economics |
While the US runs surpluses in services trade and in primary income from abroad, these have only partly offset the deficit in goods trade. Accordingly, the US runs a current account deficit of around 3% of GDP. This is lower than the peak of 6% that was reached in the mid-2000s, but the persistence of current account deficits over the past 25 years means that the US has been consuming more than it produces for an extended period of time and has accumulated large amounts of external liabilities.
Technological leadership
US dominance in technological advances is the second metric on which we set out to measure economic leadership. The US has not always been the undisputed leader in this regard. The UK held the lead in technological advancement during the Industrial Revolution in the late 18th and early 19th centuries and led major advances in computing and telecommunications later that century and in the early 20th century. German inventors made significant advances in industrial chemistry and engineering around the same time. Japanese companies such as Sony, Panasonic, and Toshiba moved to the forefront of consumer electronics in the late 20th century.
But the US also has a long history of innovation, dating back to the late 19th and early 20th centuries when inventors including Thomas Edison, Nikola Tesla and the Wright Brothers made significant contributions to the fields of communication, electricity, and transportation. Since then, the US has continued to be a leader in fields such as space exploration and information technology, the latter aided by the development of Silicon Valley from the mid to late 20th century. So far in the 21st century, the US has been at the forefront of social media, the internet of things, blockchain, cryptocurrency, reusable commercial rockets, 3D printing, gene editing and more.
There are increasingly areas in which other countries, especially Asian ones, are becoming the main innovators. Robotics in Korea, drone technology in China and nanotechnology in China and India are good examples. Indeed, according to the Australian Strategic Policy Institute’s Critical Technology Tracker, China is now the global leader in 37 of the 44 key technologies that it tracks, in a range of fields including space, robotics, energy, the environment, biotechnology and AI. (See here.)
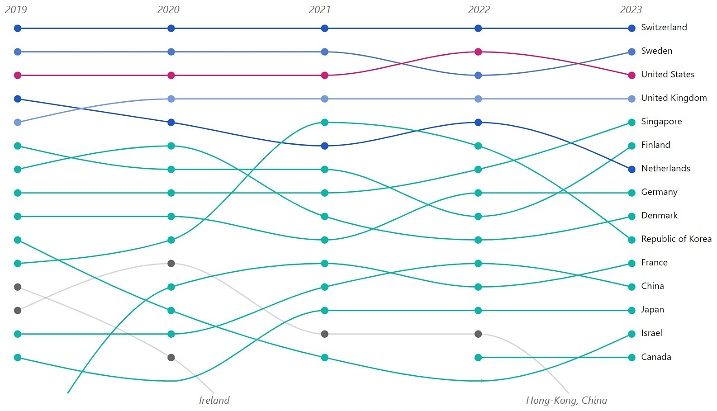
But, according to the World Intellectual Property Organisation’s Global Innovation Index, the US has consistently been among the world’s top three innovators, with only Switzerland and Sweden ranking above it. (See Chart 1.9.) This is based on a broader combination of factors including R&D investment, patent filings, computing power, scientific publications, connectivity and the institutional framework to disseminate technology. So while China has made huge advances in the technology itself, it lacks the institutional and regulatory framework to disseminate and utilise it fully.
|
Chart 1.9: WIPO Global Innovation Index (Top 15 innovators, 2020–2023) |
|
|
|
Source: WIPO |
Financial leadership
Few would disagree that the US has the world’s deepest and most liquid financial markets and hence is “dominant” in terms of financial leadership.
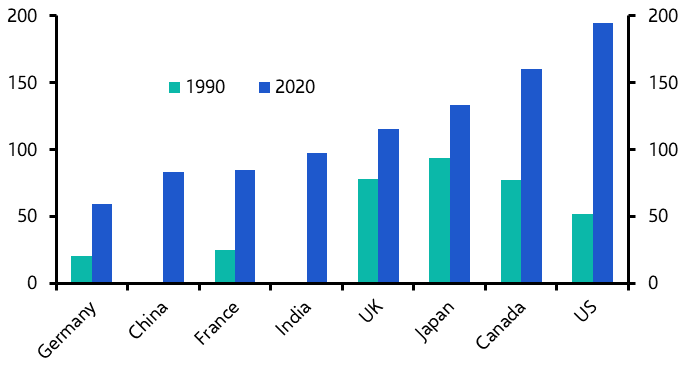
Stock market capitalisation is equivalent to around 200% of GDP, which is considerably higher than in other advanced economies. (See Chart 1.10.) Admittedly, this has not long been the case. As recently as 1990, the UK, Japan and Canada all had larger stock markets relative to their GDP. But given the sheer size of the US economy, this has meant that the US stock market is much larger than any other. US equities account for nearly 65% of the MSCI All Country World Index (ACWI), and the next represented country is Japan, accounting for barely 5% of the index.
|
Chart 1.10: Stock Market Capitalisation to GDP (%) |
|
|
|
Source: World Bank Global Financial Development Database |
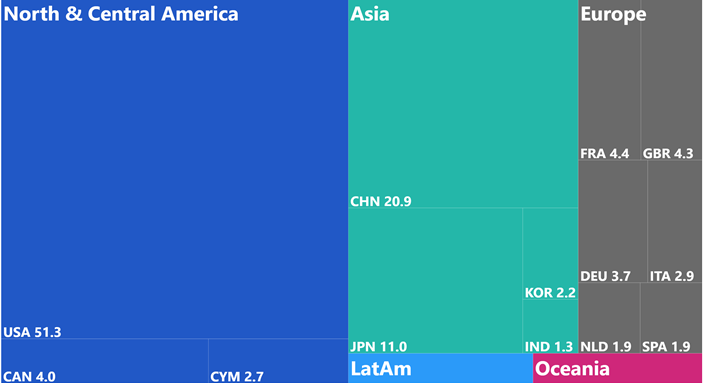
The US bond market is easily the largest in the world, at over $51trn compared to $21trn for China and around $20trn for Europe. (See Chart 1.11.)
|
Chart 1.11: Total Debt Securities Outstanding ($trn) |
|
|
|
Sources: BIS, Reuters, Eastspring Investments |
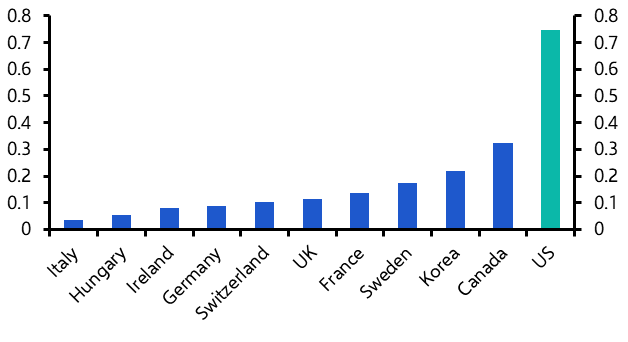
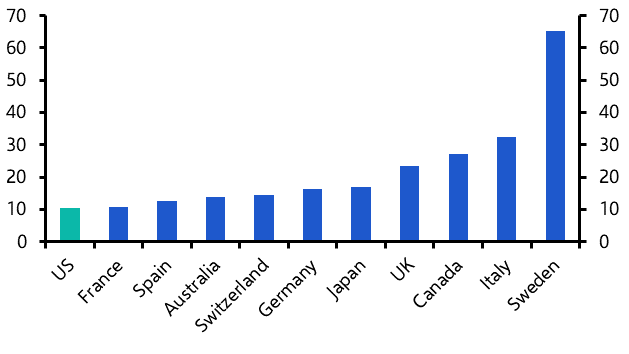
Venture capital markets are also very well-developed, with such investment now equivalent to around 0.7% of GDP. (See Chart 1.12.) This is twice the equivalent share in the second ranked OECD economy, Canada. Given the size of the economy, this means that venture capital in millions of dollars far outsizes that elsewhere.
|
Chart 1.12: Venture Capital Investments (% of GDP) |
|
|
|
Source: OECD |
Most importantly, the dollar is the dominant currency in the world. This supports demand for US assets including government debt, benefits US companies and consumers through the liquidity and stability of their currency and theoretically allows them to borrow at lower interest rates than in the rest of the world. Dollar dominance also offers significant revenues from so-called “seigniorage” and gives the US more leverage in geopolitical negotiations via its ability to limit access to dollars.
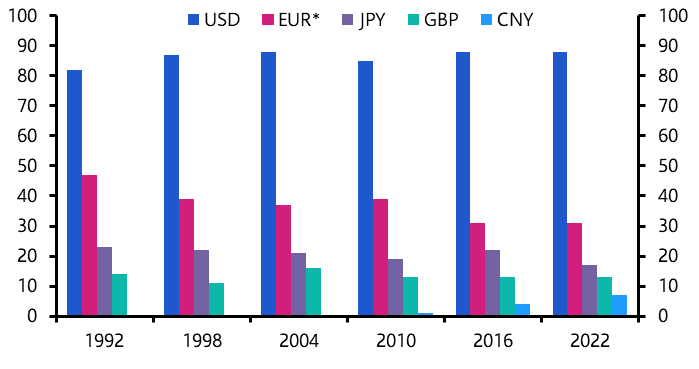
One reason for dollar dominance is that the dollar is the world’s pre-eminent reserve currency. But the currency’s financial and geopolitical influence goes beyond this and stems principally from the dominant use of the dollar (and by extension the US financial system) in cross-border transactions. According to the triennial survey conducted by the BIS, 88% of transactions in the foreign exchange market in 2022 took place in dollars – almost exactly the same as in the 1980s, when the survey began. Meanwhile, only around 5% involve the renminbi. (See Chart 1.13.) This means that most transactions will touch the US financial system at some point, which gives the economy huge influence and leverage.
|
Chart 1.13: Share of FX Transactions (%) |
|
|
|
Sources: BIS, CE,*Sum of pre-euro currencies pre-2001 |
But it is important to note that financial market dominance in terms of size and depth has not always meant higher stock market returns. What’s more, economic outperformance has not always led to financial market outperformance.
Best all-rounder
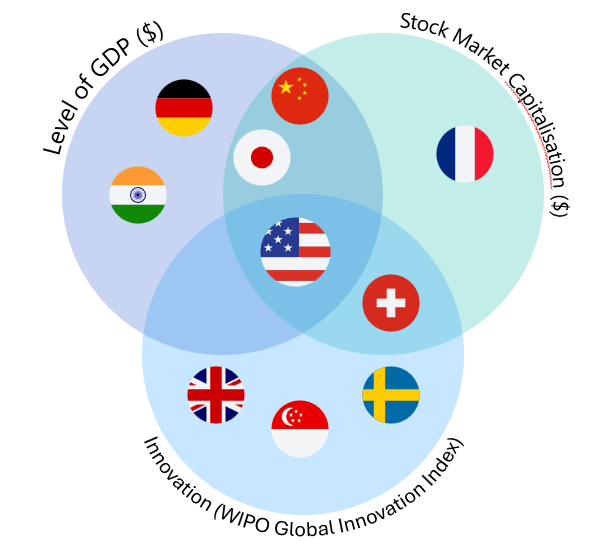
The key point to wrap up is that while the US economy is not number one in all respects, it is there or thereabouts across a wide range of fields. In other words, the breadth of its economic success stands out as much as the extent of its lead. It is the world’s largest economy with the world’s largest stock market and it ranks in the top three for innovation. Indeed, it is the only economy in the world to rank in the top 5 across all three spheres and this has long been the case. (See Chart 1.14.)
|
Chart 1.14: The World’s Top 5 |
|
|
|
Sources: Refinitiv, WIPO, Capital Economics |
Its GDP growth hasn’t been the fastest in the world, largely owing to the higher starting level and no opportunity for catch-up. But it has been strong for its stage of development, and stock market returns have been impressive over recent years too. This ongoing strong performance has left other economies struggling to keep pace, let alone to rival the US as the dominant force in global economics.
But can this continue or are the stars aligning for a new force to take over in the next few decades? To answer that, we need to consider what has caused US economic leadership in the first place. How has the US managed to develop and retain its lead and, on the other side of the coin, what has prevented other countries from catching up? What has the US got right and others got wrong, or at least less right?
Open to migration
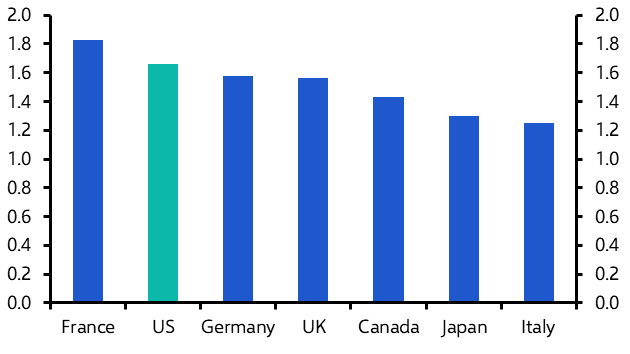
As we explained above, stronger population growth has been part of the story. This partly reflects differences in growth of the native-born population, with the US tending to have a higher fertility rate than other major developed countries. Even in recent years, when fertility rates in all countries have fallen, they have fallen to lower levels in some, including Japan and Italy, than in others, including France and the US. (See Chart 2.1. We have shown data for 2019 before temporary pandemic-related effects kicked in.)
|
Chart 2.1: Total Fertility Rate (%, 2019) |
|
|
|
Source: World Bank |
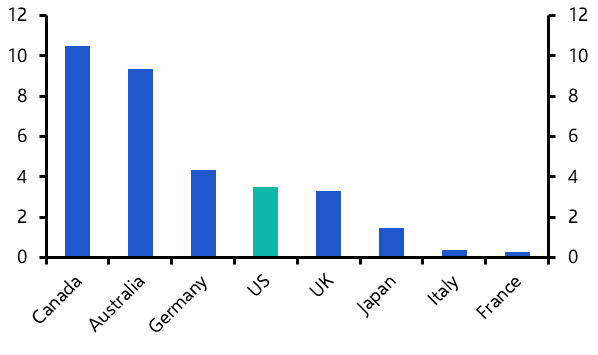
Differences in migration have also played a role. The US has a long history of being open to immigrants. As Chart 2.2 illustrates for the period just before the pandemic, the relatively high migration rates of Germany, the US and UK contrast with the lower ones of Japan, Italy and France – although Canada and Australia have surpassed them all.
|
Chart 2.2: Migration Rate (Migrants per 1,000 Population, 2019) |
|
|
|
Source: UN |
Flexible labour markets
Another part of the story is that other countries simply work less than the US.
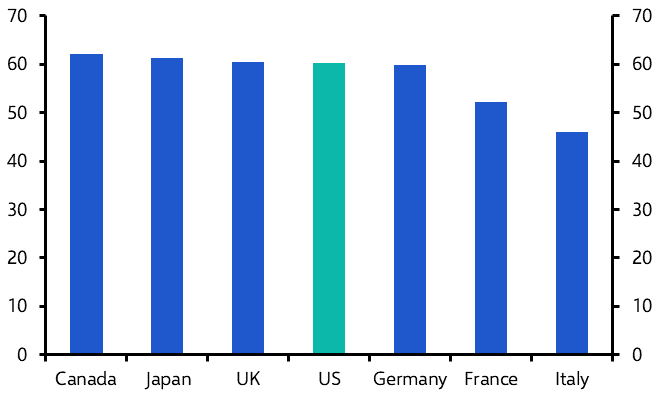
This is partly down to differences in the share of the population that works (in other words, the employment rate). As Chart 2.3 shows, the key question here is not so much why the US does so well – as it has broadly the same employment rate as quite a few other countries – but rather why France and Italy compare so unfavourably.
|
Chart 2.3: Employment Rate (%, 2023, 16+ population) |
|
|
|
Source: OECD |
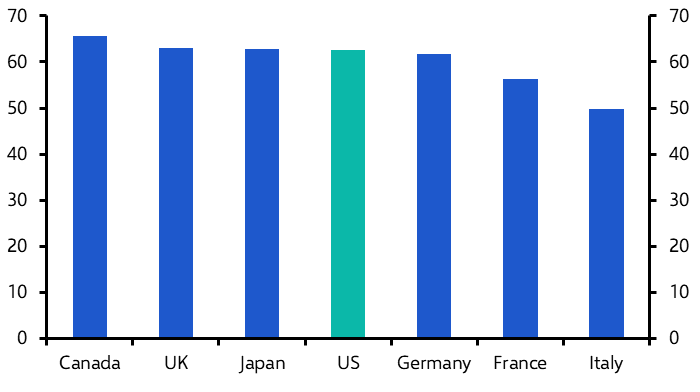
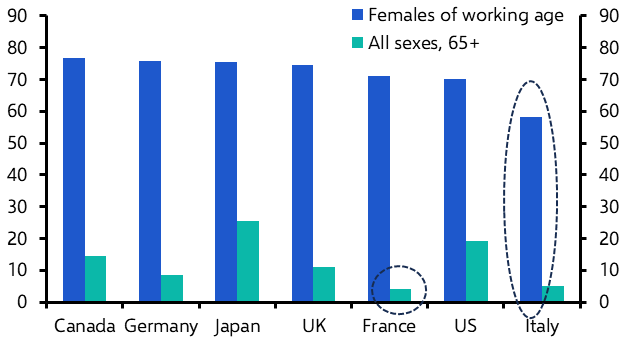
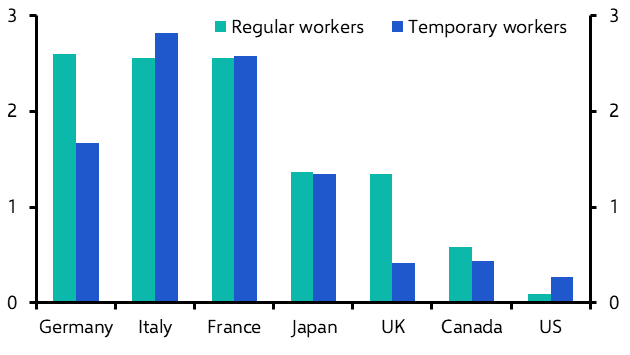
One reason is differences in the participation rate, i.e. the share of the population that is in, or looking for, work. (See Chart 2.4.) This is notably lower in France and Italy than the other major DMs including the US. In Italy’s case, cultural factors play a big part; its working-age female participation rate is 58%, compared to 70% in the US (and 76% in Canada). Meanwhile, France struggles to keep older workers in the workforce (see Chart 2.5), partly reflecting its relatively generous pension system.
|
Chart 2.4: Labour Market Participation Rates (%, 16+ population) |
|
|
|
Source: OECD |
|
Chart 2.5: Labour Market Participation Rates (%) |
|
|
|
Sources: OECD |
In addition to lower participation rates, France and Italy fare worse than other countries at getting those who want a job into employment. In the jargon, they have a higher equilibrium rate of unemployment (i.e. the rate that is consistent with low and stable wage growth and inflation). (See Chart 2.6.)
|
Chart 2.6: Equilibrium Unemployment Rate (%) |
|
|
|
Sources: Refinitiv, Capital Economics |
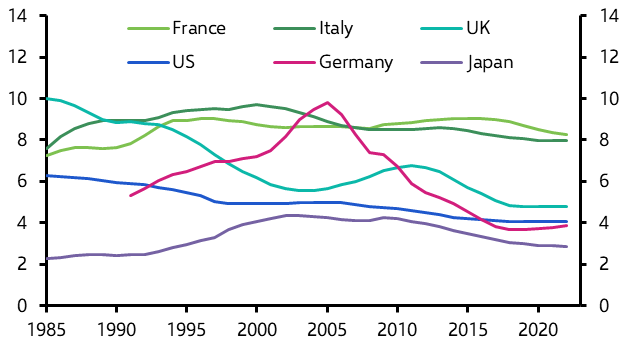
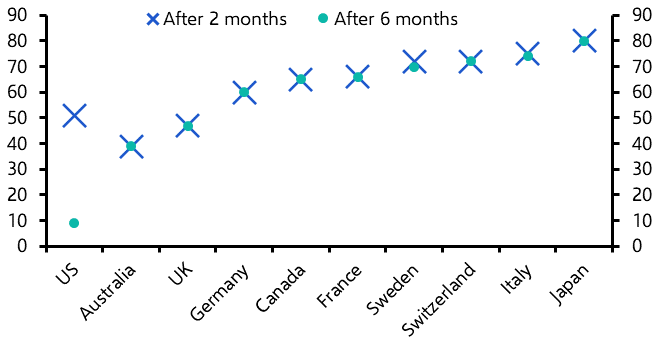
The US has generally had a relatively low natural rate of unemployment, which tends to be put down to its more flexible labour market. Chart 2.7 shows that the US has particularly low levels of employment protection, meaning that firms can hire and fire without too much difficulty. And Chart 2.8 shows the relatively low level of unemployment benefits in the US, which makes job-seekers more likely than otherwise to accept the jobs on offer. That said, we can’t make too much of these factors. After all, the UK and Germany have closed much of the gap in their natural rate of unemployment with the US in recent years. And Japan has an even lower natural rate of unemployment than the US, despite having stricter employment protection and more generous benefits. This probably partly reflects Japan’s lifetime employment model.
|
Chart 2.7: OECD Employment Protection Indicators |
|
|
|
Source: OECD |
|
Chart 2.8: Net Replacement Rate in Unemployment (% of In-Work Income, Single Person without Children) |
|
|
|
Source: OECD |
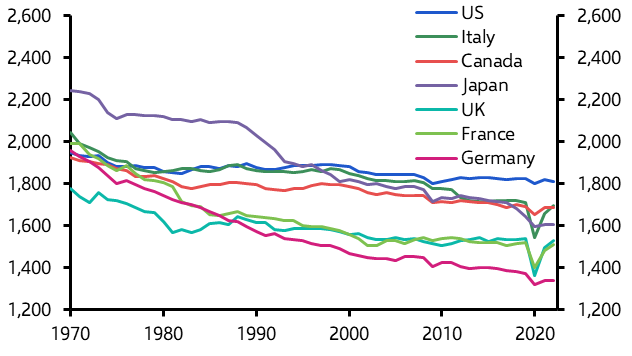
When it comes to average hours worked by those in employment, the US stands out more clearly from the crowd. Over the years, there has been a general decline in average hours worked in most countries in contrast to the stable level seen in the US. (See Chart 2.9.) Accordingly, average weekly hours worked in the US are now higher than elsewhere. One aspect of this is a higher prevalence of part-time work outside of the US. (See Chart 2.10.)
|
Chart 2.9: Average Annual Hours Worked of all People |
|
|
|
Sources: OECD, Capital Economics |
|
Chart 2.10: Part-Time Work (% of All Employment) |
|
|
|
Sources: Refinitiv, Capital Economics |
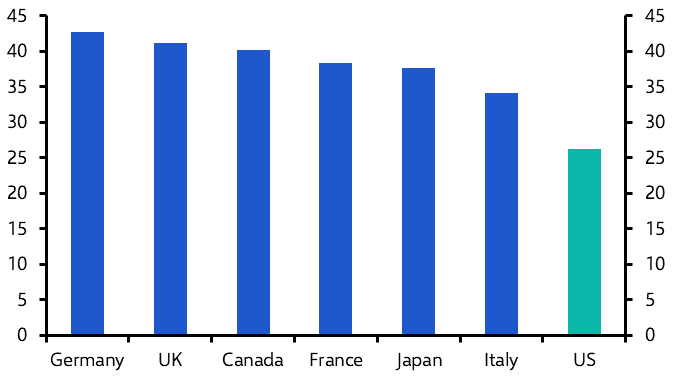
There are various possible explanations for why the US works longer hours. One is the low level of trade unionisation in the US, given that one objective of trade unions is often a shorter working week or longer holidays. (See Chart 2.11.) Meanwhile, the higher levels of inequality in the US may act as an incentive for those at the lower end of the income distribution to work longer hours to try to climb the pay ladder. US workers may put more value on consumption relative to leisure, while the US may have a different work ethic – perhaps linked to the entrepreneurial culture that we discuss later.
|
Chart 2.11: % of Employees Belonging to a Trade Union (2020 or Latest) |
|
|
|
Source: OECD |
The right ingredients for productivity growth
So, US leadership and outperformance is explained partly by the size and structure of the workforce. But the more important piece of the jigsaw is the US’s productivity performance.
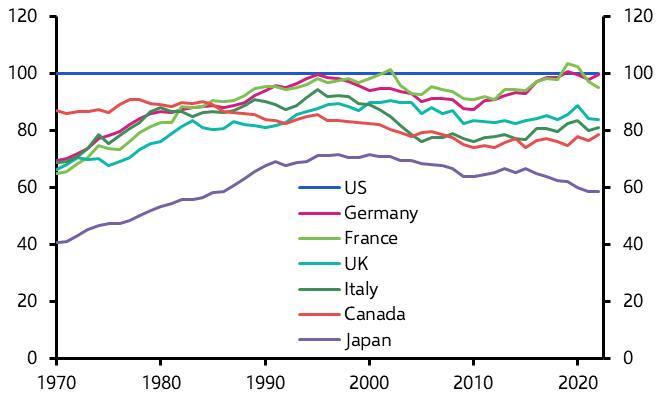
Productivity growth in different countries has ebbed and flowed and there have been times when it has generally been faster outside the US, notably the 1970s and 1980s. During this period, most countries closed the gap with the US in terms of output per hour worked, and France and Germany briefly matched it, as they have also done in the last few years. But the general picture is that the US has managed to keep its lead. (See Chart 2.12.)
|
Chart 2.12: Output Per Hour Worked (As a % of US GDP, $, current prices) |
|
|
|
Sources: Refinitiv, Capital Economics |
There are various reasons for the US’s strong productivity performance, many of which also explain why the US is the world’s technological and financial leader. Indeed, the explanations for the US’s relative success are a complex web of interactions and interdependencies. For example, the US is productive and rich in part because of its well-developed financial markets, but at the same time, its superiority in financial markets derives partly from its economic success.
We can boil the list of US advantages down to five main areas; size; depth of capital markets; policy environment; skilled workforce; and entrepreneurial culture.
First, the sheer size of the US means that companies have the natural advantage of a large single market that offers large rewards to scale, helped by the common language across the whole country. Although Europe’s single market is broadly comparable in size, it does not compete in scope (for example, the services sector has not been fully opened up) and businesses still face other internal barriers due to different languages, cultural differences and legal/regulatory variations.
The US’s large geographical mass has also given it access to a range of natural resources in the past. Since the shale revolution, in particular, the US’s plentiful and cheap domestic supply of energy has insulated it somewhat from fluctuations in the global supply and prices of energy, including during the Ukraine war. Energy innovation has allowed the US to become a net oil exporter (although it still has to trade to get the types of oil it needs). If we consider all types of energy (including natural gas), the US surplus is larger still. In contrast, the largest euro-zone economies, China and Japan are still heavily dependent on imported energy. (See Chart 2.13.)
|
Chart 2.13: Energy Trade Balance ($bn) |
|
|
|
Sources: ITC |
The second big advantage for the US is the depth of its capital markets. For small and medium sized companies, there is a notable contrast with Europe, in particular, where bank lending is more important. This makes it hard, and potentially costlier, for those companies with little collateral or a lack of credit history to raise funds. The US’s well-developed venture capital sector that we mentioned above also plays a key role in funding innovation and start-ups, especially given how it interacts with the US’s strong higher education sector (as start-ups companies are often spun off from university research). According to the QS World University Rankings, the US has 12 of the world’s top 20 ranked universities (while the UK has 4, Australia 1, China 1, Singapore 1 and Switzerland 1).
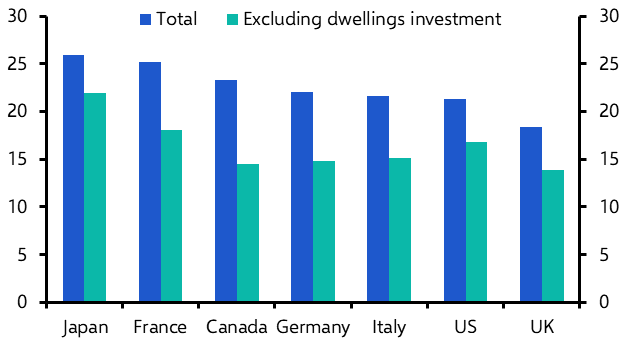
Admittedly, this does not translate into an especially high overall investment share of GDP. (See Chart 2.14.) Excluding residential investment (which arguably has less impact on long-term economic growth than other types of investment), the US fares better – although still not as well as Japan or, since 2021, France.
|
Chart 2.14: Gross Fixed Capital Formation (As a % of GDP) |
|
|
|
Source: OECD |
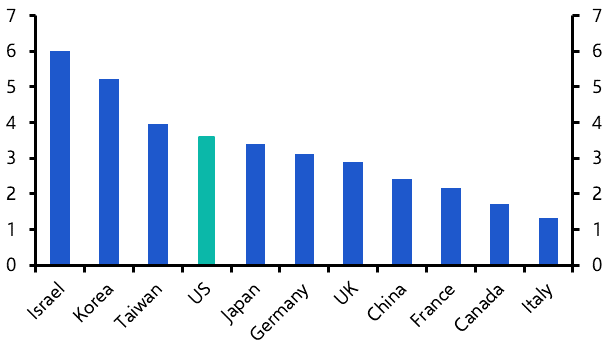
However, it probably does play a role in the US’s high investment in R&D, which is crucial to its technological leadership. Indeed, a post-war surge in public and private investment in R&D was one of the key factors behind the US initially pulling ahead of other countries after the Second World War. Today, the US spends the equivalent of 3.5% of GDP on R&D, over twice the level in Italy. (See Chart 2.15.) Only Israel, Korea and Taiwan currently outdo the US; while China has seen an impressive pick-up in R&D spending, it still lags behind the US.
|
Chart 2.15: Domestic Expenditure on R&D (As a % of GDP, 2022) |
|
|
|
Sources: OECD |
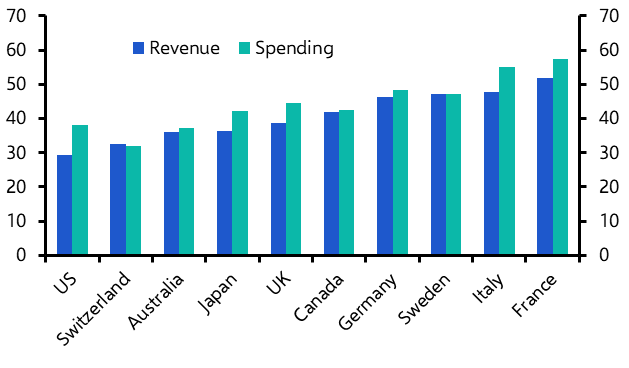
The third set of factors playing to the US’s advantage relate to the policy environment, although the picture here is more nuanced. The US’s relative success is sometimes ascribed to the small size of its state; government tax and spending are low as a share of GDP. (See Chart 2.16.) But other countries – most notably those in Scandinavia – achieve high levels of productivity and GDP per capita even though the state plays a much bigger role there. And corporation tax rates among DMs are not vastly different from each other – and certainly none are close to Ireland’s exceptionally low rate. (See Chart 2.17.)
|
Chart 2.16: Government Revenue and Spending (% of GDP, 2023) |
|
|
|
Sources: OECD |
|
Chart 2.17: Corporate Income Tax Rates (%, Combined Central and Sub-Central Government) |
|
|
|
Sources: OECD |
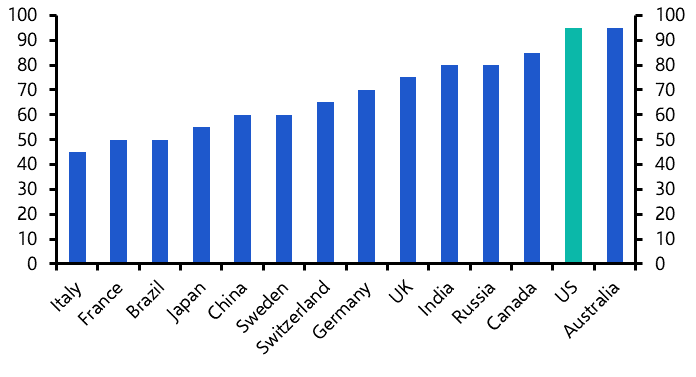
Perhaps more important is the more favourable regulatory environment in the US. The US has traditionally embraced a more laissez-faire approach to regulation than Europe in particular (although note that it ranks quite poorly in the OECD’s indicator of product market regulation). And the US fares well on institutional set-up; Chart 2.18 illustrates this with respect to the financial system. The US scores very highly on the World Bank’s “Getting Credit” indicator of its Doing Business Index, which measures the strength of credit reporting systems and the effectiveness of collateral and bankruptcy laws in facilitating lending.
|
Chart 2.18: World Bank Getting Credit Indicator, 2020 |
|
|
|
Sources: World Bank |
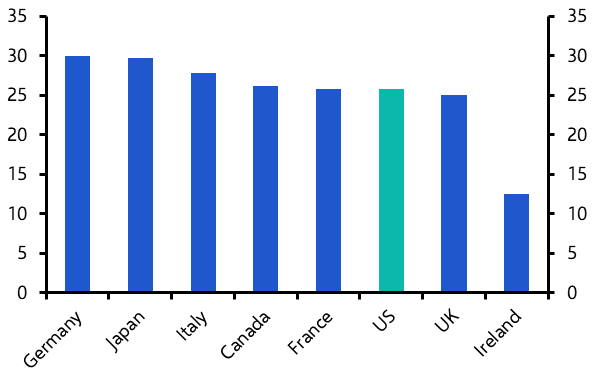
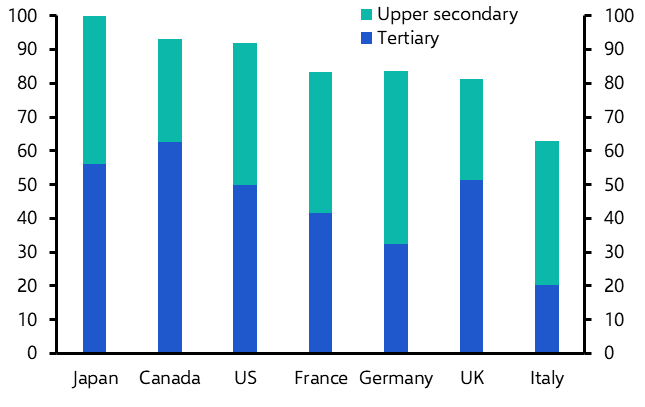
The fourth key element to the US’s success lies in the quality and structure of its workforce. The US is near the top in terms of education levels. Japan, Canada and the US all have over 90% of their working age population educated to upper secondary or tertiary level. Italy falls particularly short, with barely 60% educated to this level. (See Chart 2.19.)
|
Chart 2.19: Share of Working-Age Population by Education Level (%) |
|
|
|
Source: OECD |
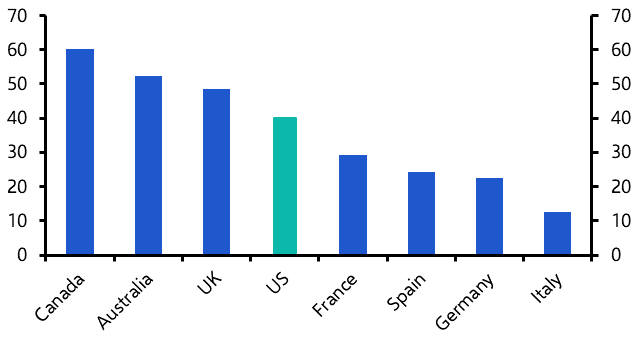
Meanwhile, the US is amongst those countries that attract high numbers of skilled migrants. As Chart 2.20 shows, the US, Canada, Australia and the UK have high shares of immigrants that are educated to university level. The rest of Europe trails behind.
|
Chart 2.20: % of Foreign-Born Population Aged 15+ Educated to Tertiary Level, 2017 |
|
|
|
Sources: OECD |
The US does particularly well at attracting skilled migrants in those sectors which are most important to technological progress. This includes students in STEM sectors, many of whom stay on to work in the US. While overseas students account for around 5.5% of overall US higher education students, they account for 30% of science and engineering students and over 60% in some areas like computer science. (See Table 2.1.) This partly reflects the US’s open attitude towards highly skilled migration. It is also a virtuous cycle; the US does well at innovation, which attracts tech workers, which advances its innovation further.
|
Table 2.1: Composition of US graduate students, 2022 |
|
|---|---|
|
Degree course |
% that are international students |
|
All subjects |
5.6 |
|
Science & engineering |
37.3 |
|
Petroleum engineering |
75.1 |
|
Computer engineering |
74.3 |
|
Computer & info science |
64.5 |
|
Ind. & manuf. engineering |
67.5 |
|
Source: National Science Foundation |
|
The differences in labour market structure that we discussed earlier also play a role in explaining why some countries are worse than the US at exploiting technological advancements. For example, less flexible labour markets in Europe have made it harder to reorganise workplaces to take advantage of new technologies. Meanwhile, long-standing factors that might be holding back productivity in Japan include its low labour mobility (reflecting long job tenure) and its reluctance and/or inability to attract many high-skilled migrants.
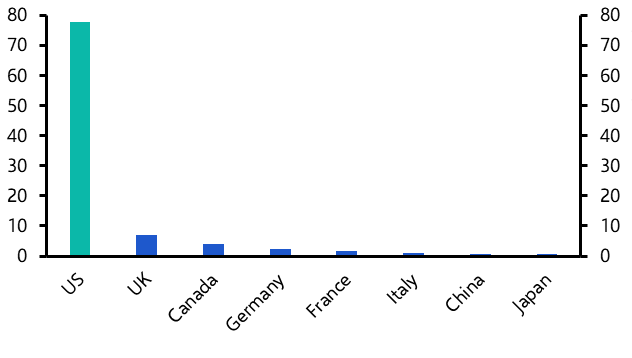
The US’s fifth key advantage is a cultural environment that encourages innovation and start-ups. This is perhaps the hardest factor to pin down and quantify, but might well be the most important. The US is generally considered to have a more risk-taking culture, perhaps the flipside of its high levels of inequality. This is shown in its high level of start-ups. (See Chart 2.21.) Contrast this with Japan, in particular, which has a low start-up rate of new firms and protection of small and medium enterprises which prevents creative churn.
|
Chart 2.21: Number of Active Start-ups (2024, 000s) |
|
|
|
Source: Startup Ranking |
This is an exclusive extract from our full client report. Click below to see the full report, including in-depth financial markets analysis and interactive data dashboards.

Will the US economy and markets be overtaken?
Get the full insight, interactive data and access to our economists. Find out how we can help you.