
Q3 Australia & New Zealand Economic Outlook
RBA won’t cut interest rates until mid-2025

Both the Australian and New Zealand economies are still struggling to cope with high interest rates. Notwithstanding the prospect of increased fiscal support, growth is likely to remain below potential for a while.
These are just some of the key takeaways from our latest quarterly Australia & New Zealand Economic Outlook, originally published on 26th June, 2024. Some of the forecasts contained within may have been changed since publication. Access to the complete report, including extensive forecasts and near to long-term analysis, is available as part of a subscription to our CE Advance premium platform or to our dedicated Australia & New Zealand coverage.
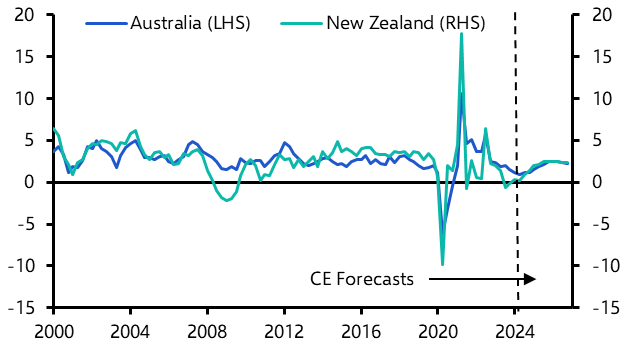
Activity has slowed to a standstill in both countries. Although output growth should gather momentum going forward, it will remain below its pre-pandemic average. However, with underlying inflation still running well above target, central banks will be wary about taking their foot off the brakes. We think the RBNZ will cut rates only in Q4 2024 and we’re pushing back our forecast for the first RBA rate cut from Q1 to Q2 next year.
- Activity has slowed to a standstill in both countries. Although output growth should gather momentum going forward, it will remain below its pre-pandemic average. (See Chart 1.) However, with underlying inflation still running well above target, central banks will be wary about taking their foot off the brakes. We think the RBNZ will cut rates only in Q4 2024 and we’re pushing back our forecast for the first RBA rate hike from Q1 to Q2 next year.
- Some analysts have argued that the sharp slowdown in Australia’s real GDP has been driven more by a lack of supply rather than demand. Accordingly, they claim that capacity pressures have eased less than the headline GDP figures would suggest. However, that argument flies in the face of data which show that capacity utilisation has fallen almost exactly as much as one would expect given the recent weakness in activity growth. (See Chart 2.)
|
Chart 1: Real GDP (% y/y) |
Chart 2: Aus. Real GDP Growth & Capacity Utilisation |
|
|
|

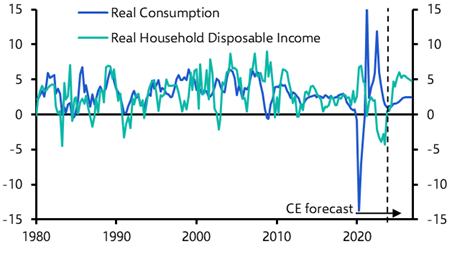
- With Stage 3 tax cuts set to meaningfully boost households’ real incomes in Q3, there is a risk that consumer demand follows suit. However, our baseline forecast is that any pickup in private consumption will be relatively modest. (See Chart 3.) After all, by their own admission, households intend to save the overwhelming majority of incoming tax cuts.
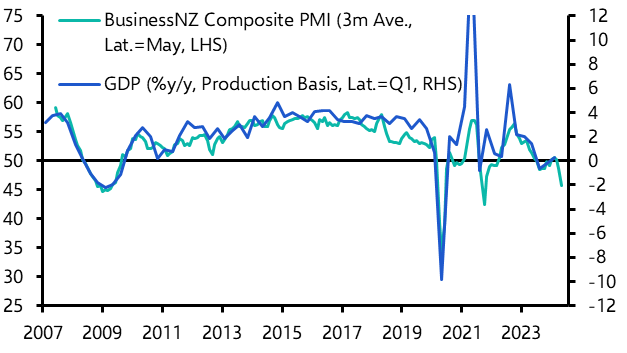
- Meanwhile, the New Zealand economy is clearly in more dire straits. Having contracted in four out of the last six quarters, the economy remains 0.5% below its late-2022 peak. While we think that the worst is now over, risks remain tilted to the downside. Indeed, PMI data suggest that output could well shrink again in Q2. (See Chart 4.)
|
Chart 3: Aus. Real Household Income & Real Consumption (% y/y) |
Chart 4: BusinessNZ Composite PMI & Real GDP Growth |
|
|
|
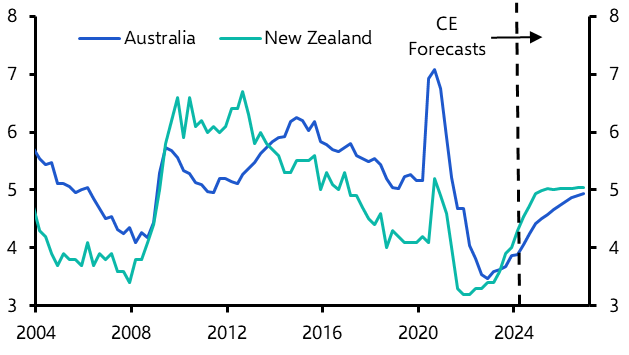
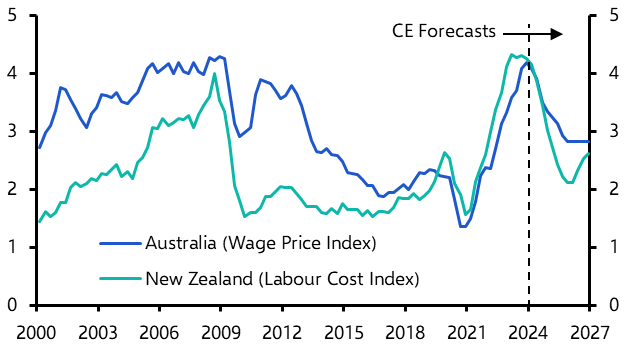
- The labour market has loosened in both economies, owing in large part to record breaking growth in the working-age population. However, the Australian economy has been able to absorb new labour market entrants to a greater degree, meaning the unemployment rate has not risen as sharply as in New Zealand. (See Chart 5.) And while wage growth is past its peak in both countries, we suspect it will moderate more slowly in Australia (see Chart 6), partly reflecting the larger share of employees covered by enterprise bargaining agreements.
|
Chart 5: Unemployment Rate (%) |
Chart 6: Labour Cost Indices (% y/y) |
|
|
|
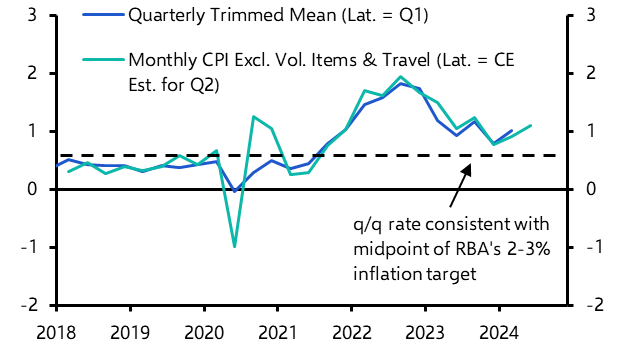
- The relative tightness of the Australian labour market will keep growth in compensation of employees elevated, complicating the RBA’s efforts to tame underlying inflation. (See our Focus.) Indeed, the ABS’ monthly CPI indicator suggests that trimmed mean CPI is still rising too briskly to be consistent with the Bank’s inflation mandate. (See Chart 7.) Accordingly, the RBA is likely to maintain its hawkish bias at its upcoming meeting in August.
- In our view, the RBA is unlikely to actually follow through on another rate hike. For one thing, the economy is just barely muddling along, meaning demand should soon start to fall short of supply. For another, inflationary pressures coming out of the labour market are set to cool further. If labour income continues to grow at the 1% q/q rate we saw in Q1, unit labour cost growth should fall to levels consistent with the RBA’s 2-3% target by mid-2025. That said, we do think the RBA will cut rates later and less aggressively than the RBNZ.
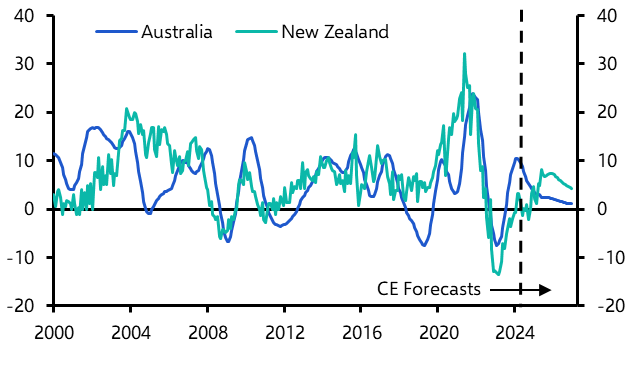
- With the RBA having only limited room for policy loosening, affordability constraints will dampen house price growth for the foreseeable future. By contrast, New Zealand’s housing rebound, which has largely stalled in recent months, should kick off in earnest once the RBNZ pivots to an easing cycle later this year. (See Chart 8.)
|
Chart 7: Aus. Consumer Prices (% q/q) |
Chart 8: House Prices (% y/y) |
|
|
|
|
Sources: Refinitiv, RBA, CoreLogic, BusinessNZ, StatsNZ, CE |
Activity: Economic rebound will underwhelm
- Both economies are still struggling to cope with high interest rates. Notwithstanding the prospect of increased fiscal support, growth is likely to remain below potential for a while.
- The Australian economy barely treaded water in Q1, growing by just 0.1% q/q. As a result, annual GDP growth fell to just 1.1%, its weakest result since the early 1990s, once we exclude the pandemic. Although activity should pick up in q/q terms going forward, we think it will grow below trend throughout the forecast period.
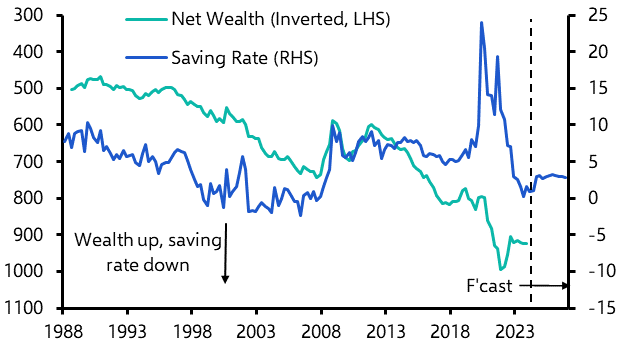
- In its latest national accounts release, the ABS made noticeable upgrades to its estimates for private consumption over the past year. However, the other side of the coin is that the households’ savings rate is now markedly lower than previously thought. We suspect households will seek to rebuild their savings buffers in the coming quarters, which should attenuate private consumption growth in the near term. (See Chart 9.)
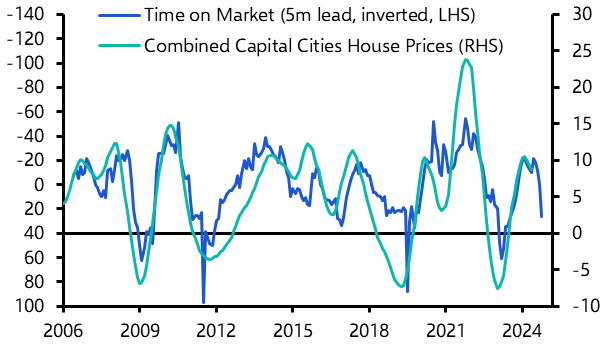
- Some observers have argued that housing wealth effects could still persuade households to turn on the spending taps, especially with Stage 3 tax cuts due on July 1st. However, we remain sceptical. For one thing, house price growth has already come off the boil. And our “time on market” indicator suggests that slowdown has much further to run. (See Chart 10.)
|
Chart 9: Aus. Household Net Wealth & Savings Rate |
Chart 10: Aus. Time on Market & Combined Capital Cities House Prices (% y/y) |
|
|
|
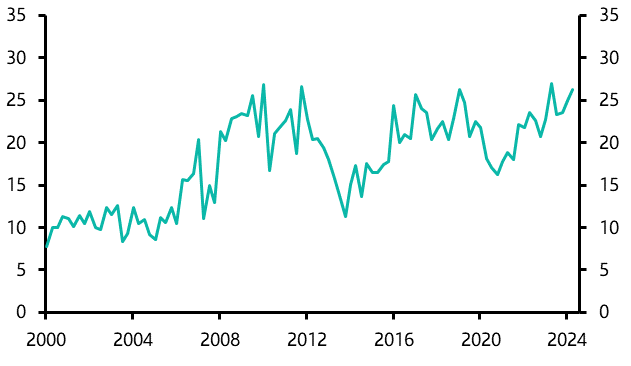
- For another, with household indebtedness at close to its all-time high, a growing share of households believes that savings are best used for deleveraging. (See Chart 11.)
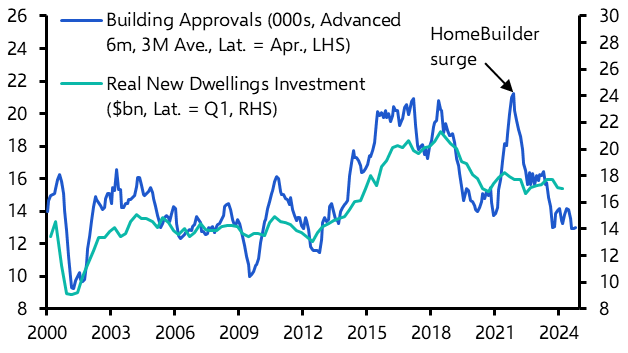
- There are other signs that the property sector will do little to support activity in the near term. New dwellings investment fell by 0.6% in Q1, its third consecutive quarterly decline. Going by the sustained weakness in building approvals, it will be a while before residential investment finds a floor. (See Chart 12.) We expect a further 6% decline by mid-2025.
|
Chart 11: Share of Survey Respondents Saying Wisest Place to Put Savings is “Paying Off Debt” (%) |
Chart 12: Aus. Building Approvals & Real New Dwellings Investment |
|
|
|
- For their part, Australian firms are dialling back their investment intentions, albeit only slightly. The ABS’ Q1 capex survey points to real business investment rising by 5.8% in 2024/25, down just a notch from 6.5% in 2023/24. However, we think risks are tilted towards a substantially weaker outcome, not least because of the ongoing plunge in non-residential building consents. (See Chart 13.)
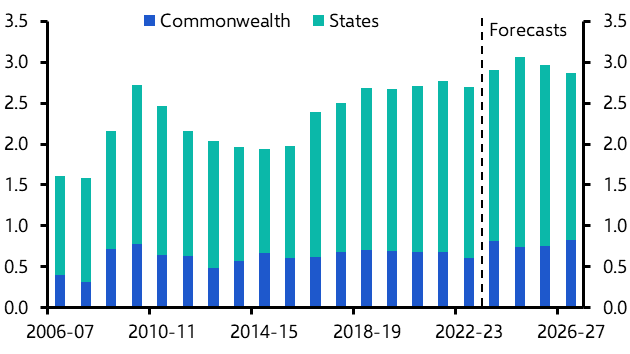
- On the flip side, government capex is poised for further gains, with states set to splurge on public works. (See Chart 14.) Although budget execution will be complicated by bottlenecks in the construction industry, public investment will nonetheless help to cushion the growth outlook somewhat.
|
Chart 13: Aus. Non-Residential Building Approvals & Non-Residential Building Investment (Nominal, $bn) |
Chart 14: Aus. Public Gross Fixed Capital Formation |
|
|
|

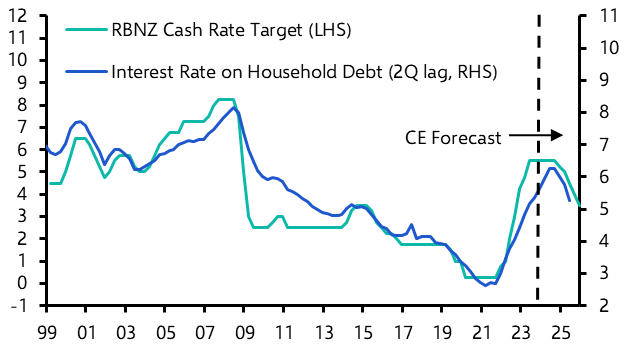
- The New Zealand economy came out of recession in Q1, albeit with real GDP rising by a rather soft 0.2% q/q. There are good reasons to believe the worst is now behind us. After all, the transmission of monetary tightening via the household cashflow channel is nearly complete. (See Chart 15.) That said, further increases in interest charges over the course of the year will still knock off nearly 1%-pt from households’ disposable incomes, meaning that private consumption is unlikely to stage a vigorous rebound.
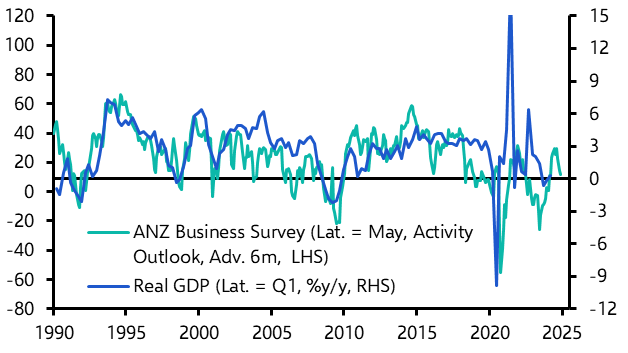
- There are signs elsewhere too that the recovery is likely to be choppy. The latest surveys show that firms are growing increasingly sour on the outlook for activity. (See Chart 16.) Insofar as that translates to lower investment and production, it reinforces our view that output growth is likely to remain tepid.
|
Chart 15: RBNZ Cash Rate & Interest Charged on Household Debt (%) |
Chart 16: ANZ Firms’ Activity Outlook & Real GDP Growth |
|
|
|
|
|
Sources: |
Capital Economics clients get the full analysis, including:
- Labour Markets – Unemployment rates have edged higher in both countries and leading indicators suggest that the labour market will continue to cool in the coming months. Against this backdrop, we expect wage growth to moderate further in both countries as well.
- Prices – Headline inflation will return to the target range in both countries by the second half of this year. However, measures of underlying inflation are likely to take longer to follow suit.
- Monetary & Fiscal Policy – With governments in both countries set to inject fresh stimulus into the economy, the Antipodean central banks will be wary about prematurely loosening monetary policy. That means the RBNZ and the RBA will be among the last DM central banks to cut rates.
These are highlights from a sample of the 14-page Australia & New Zealand Economic Outlook prepared for Capital Economics clients, published on 26th June 2024 and written by Marcel Thieliant, Abhijit Surya and Au Yu Toh.
Get the full report
Trial our services to see this complete 14-page analysis, our complete ANZ macro insight and forecasts and much more