
Q2 2025 US Economic Outlook
Scaled-back tariffs not an existential threat

The impact on real GDP from Trump’s tariffs will depend crucially on whether (and how quickly) the customs duties raised are recycled back into the economy as new tax cuts. We assume most, if not all, of the revenue is returned to households in the upcoming budget reconciliation. Failure to do so would represent a significant fiscal tightening that could tip the economy into recession.
This is a sample of our latest quarterly US Economic Outlook, originally published on 16th April, 2025. Some of the forecasts contained within may have changed since publication. Access to the complete report, including extensive forecasts, near to long-term analysis and interactive data resources, is available as part of our subscription services.
Our working assumption is that the 90-day pause on the Trump administration’s reciprocal tariffs will be made permanent, with tariffs remaining at 10% for most countries apart from China. Providing Congress soon recycles the tariff revenue into the economy, a recession should be avoided, but GDP growth will be weaker than in recent years. We expect growth of 1.7% this year and close to 1.5% in 2026 and 2027. With the economy slowing rather than collapsing, we are sticking to our view that high inflation will keep the Fed on the sidelines this year, ahead of 50bp of cuts in 2026.
- A surge in imports appears to have dragged down first-quarter GDP, but the reversal of that surge will have an offsetting effect in the second quarter, boosting growth to more than 2% annualised. Over the rest of 2025 and throughout 2026, however, we expect quarterly growth to slow to around 1.5% annualised. (See Chart 1.)
- Those forecasts are based on the assumption that, cowed by pressure from markets, the Trump administration will not revert to country-specific reciprocal tariffs in any meaningful form. We assume that the effective tariff rate on China is reduced to 60%. In that scenario, the average tariff rate should end up close to 16%, a dramatic rise from just 2% last year but much less than the current rate of close to 23%. (See Chart 2.)
|
Chart 1: Real GDP |
Chart 2: Effective Tariff Rate (%) |
|
|
|


- The uncertainty created by the administration’s chaotic policy implementation will do some economic damage, for example by making companies less confident about large-scale investments. But the ultimate hit from tariffs depends on the extent to which Congress recycles the revenue, which could be worth at least 1.5% of GDP. (See Chart 3.) We assume that the Republicans are successful in passing a budget reconciliation within a couple of months, although it will be a big ask given the need to get the Freedom Caucus on board despite only modest spending cuts and the requirement to raise the debt ceiling at the same time.
- The administration’s tighter immigration restrictions have contributed to a further decline in encounters at the southwest border, confirming that labour force growth will be far weaker this year. (See Chart 4.)
|
Chart 3: Customs Duties (% of GDP) |
Chart 4: CBP Encounters at Southwest Border |
|
|
|


- As a result, despite forecasting a sharp slowdown in monthly payrolls to just 50,000 in the second half of 2025, we anticipate only a modest rise in the unemployment rate. (See Chart 5.)
- Tariffs will cause core CPI inflation to rise to more than 4% by the end of the year. (See Chart 6.)
|
Chart 5: Unemployment Rate (%) |
Chart 6: CPI Inflation (%) |
|
|

|

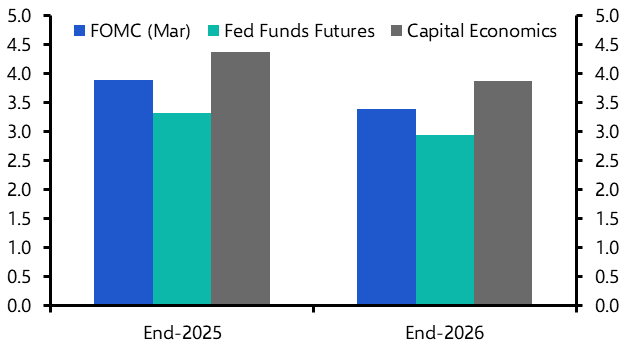
- As the economic slowdown will partly reflect weaker potential growth and the Fed will need to guard against higher inflation expectations, we expect the Fed to prioritise the inflation side of its mandate by keeping interest rates on hold this year, before cutting by 50bp in 2026. (See Chart 7.)
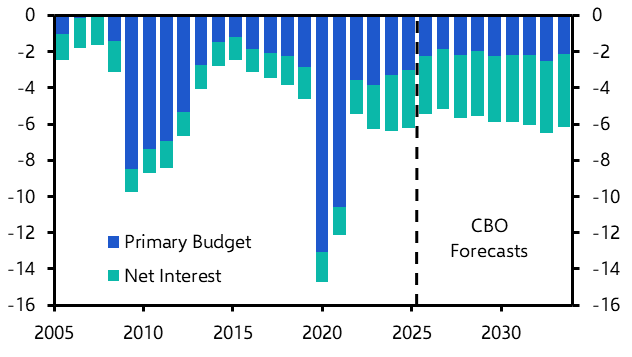
- We could be wrong about the resilience of the economy, particularly if Trump re-imposes country-specific tariffs or if Congress opts to use the tariff revenue to reduce the deficit. (See Chart 8.) In those cases, the economy would be lucky to avoid recession. While healthy private sector balance sheets would limit the risks of a modest downturn morphing into something much worse, the lack of fiscal space would leave monetary policy as the only game in town and so, despite lingering inflation concerns, the Fed would likely implement deep interest rate cuts.
|
Chart 7: Fed Funds Rate Expectations (%) |
Chart 8: Federal Budget Balance (% of GDP) |
|
|
|
|
Sources: LSEG, Federal Reserve, CBO, US CBP, Capital Economics |
- Under our assumption that, with the notable exception of China, the overall increase in the effective tariff rate is limited to around 10%-points, we would expect the negative impact on the real economy to be muted. We anticipate that most of the additional tax revenues will be recycled into the economy, as additional tax cuts included in the Republican’s upcoming major budget reconciliation. Moreover, with the dollar unexpectedly weakening and, except for China, most other countries severely limiting their retaliation, any decline in exports should be modest.
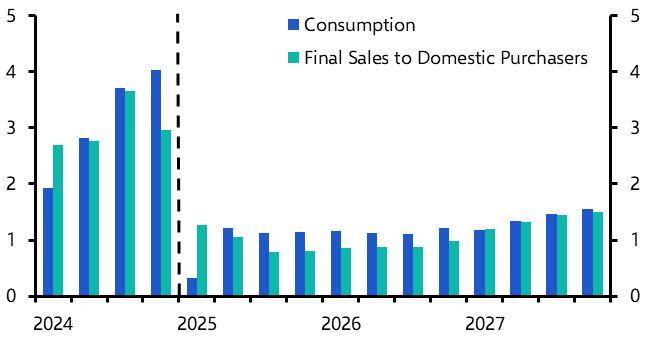
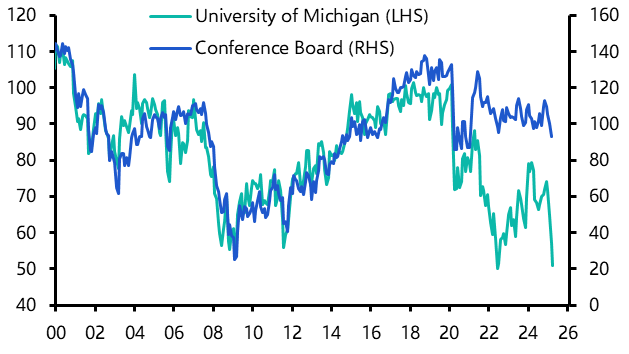
- Admittedly, we do expect real consumption growth to remain a little below 2% over the next couple of years (see Chart 9) as tariff uncertainty continues to weigh on sentiment. The University of Michigan measure appears to be unusually sensitive to inflation concerns, however, with the Conference Board’s measure pointing to only a muted decline in sentiment. (See Chart 10.) The upshot is that, unless Trump reverses course and hikes tariffs again, triggering a renewed market collapse, we don’t anticipate a recession developing.
|
Chart 9: Selected Real GDP (%q/q annualised) |
Chart 10: Consumer Confidence |
|
|
|
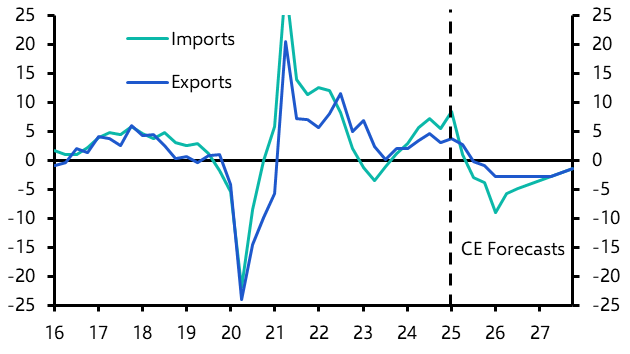
- Based on that 10%-point increase in the effective tariff rate we would expect US imports to decline in total by between 5% and 10% over the next couple of years. (See Chart 11.) The fall in exports will be smaller since, as we noted, the dollar has not strengthened unduly and retaliation by other countries has been limited. The unknown, however, is how big the negative impact on exports will be from boycotts of US goods by consumers in other countries. Exports of tourism services are likely to plummet, as foreigners take a dim view of tariffs and the immigration crackdown.
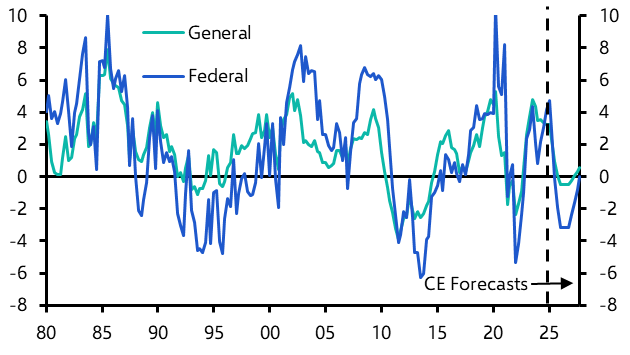
- The Elon Musk-led DOGE push to cut government appears to be winding down. We suspect the final savings will be much smaller than claimed. Nevertheless, given the spending cuts likely to be introduced with the budget, we are still assuming a 3% per year decline in Federal expenditures. (See Chart 12.)
|
Chart 11: Real Imports & Exports (%y/y) |
Chart 12: Real Government Expenditure (%y/y) |
|
|
|
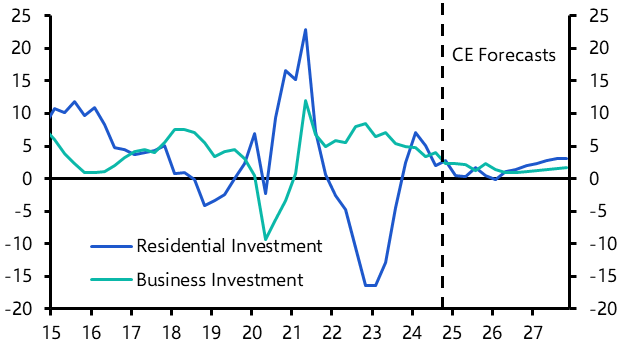
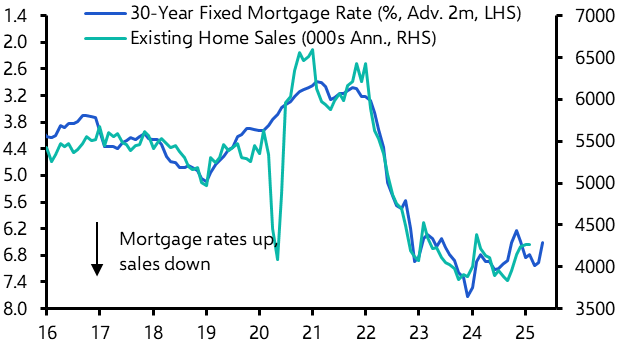
- Ongoing policy uncertainty will weigh on business investment this year. (See Chart 13.) With long rates staying stubbornly high, we’d expect any recovery in home sales and residential investment to be muted too. (See Chart 14.)
|
Chart 13: Real Fixed Investment (%y/y) |
Chart 14: Existing Homes Sales & Mortgage Rate |
|
|
|
- With the economy operating close to capacity and immigration curbs holding back labour force growth, we don’t expect the tariffs to trigger any major reshoring investment, particularly not in the near term.
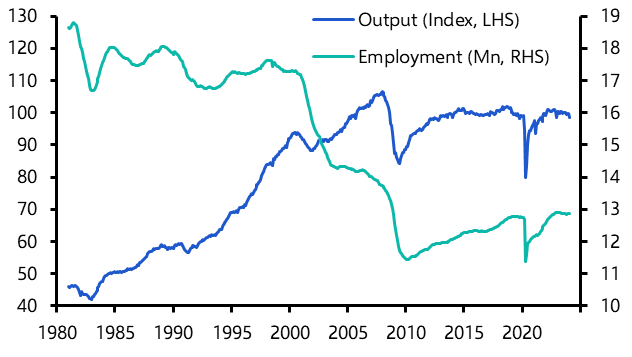
- Despite being treated as a priority since the Obama administration, manufacturing output and employment have shown no meaningful resurgence. (See Chart 15.) The 10% reciprocal tariff is too small to make a difference given the massive disparity in relative wage costs. (See Chart 16.) China’s exports will be re-routed via those other countries rather than reshored back to the US.
|
Chart 15: Manufacturing Output & Employment |
Chart 16: Manufacturing Monthly Wages ($000’s) |
|
|

|
|
Sources: LSEG, Capital Economics |
Capital Economics clients get the full analysis, including:
- Why we expect employment growth to slow, as weaker GDP growth weighs on private hiring and DOGE trims the federal workforce.
- How tariffs will push core PCE inflation towards 4% by the end of 2025, whereas lower oil prices should keep headline PCE inflation below 3.5%. But also why inflation should drop back in 2026, even if we doubt it will fall all the way to 2% unless tariffs are rolled back significantly or the economy falls into recession.
- Why the hit to real GDP from Trump’s tariffs hinges on how quickly the revenue is recycled as tax cuts and, if not, how the resulting fiscal tightening could push the economy into recession. In addition, find out why we still expect the Fed to focus on inflation risks and keep rates steady this year.
This is a sample of the 13-page US Economic Outlook prepared for Capital Economics clients, published on 16th April 2025 and written by Paul Ashworth, Stephen Brown, Thomas Ryan, Bradley Saunders and Harry Chambers.
Get the full report
Trial our services to see this complete 13-page analysis, our complete US macro insight and forecasts and much more