
Long Run Asset Allocation Outlook
Life after the bubble
April 2024

We anticipate that returns from equities over the next decade will be poorer than over the previous one. And we think that the long-running outperformance of the US stock market may come to an end. By contrast, we envisage that the returns from most bonds over the coming decade will be considerably higher than over the past 10 years or so."
These are just some of the key takeaways from our latest Long Run Asset Allocation Outlook, originally published on 24th April, 2024. Some of the forecasts contained within may have changed since publication. Access to the complete report, including more in-depth analysis and detailed return forecasts to 2050, is available as part of a subscription to our CE Advance premium platform or to our dedicated Long Run coverage.
We expect the returns from government bonds over the next decade or so to be unspectacular, but still considerably better than those over the last ten years. Meanwhile, we anticipate fairly good outturns for many “risky” assets, but relatively modest returns from US equities, at least compared to their strong gains over the past decade.
The rally in equities over the past year or so, driven in no small part by hype around AI, has left stock markets looking quite highly valued. Although we think they can continue to power ahead over the near term as a stock market bubble inflates further, we doubt this will be sustained and expect the bubble to burst beyond the end of 2025. Ultimately, we anticipate that returns from equities over the next decade will be poorer than over the previous one. And we think that the long-running outperformance of the US stock market may come to an end.
By contrast, we envisage that the returns from most bonds over the coming decade will be considerably higher than over the past 10 years or so. That’s because we think equilibrium real interest rates in developed economies will rise over the coming decade on the back of stronger productivity growth and higher government borrowing. We expect government bond yields to settle at around their current levels, providing healthy interest income.
A higher level of interest rates would also boost the collateral return from investing in commodities, although those gains might be undermined in many cases by falling spot prices. We think commodity returns in general will be poor over the coming decades, although some industrial metals may benefit from the green transition. Meanwhile, we expect the returns from real estate investment trusts (REITs) generally to keep track with the returns from equities over the coming decades, even if they lose ground in the near-term as the bubble inflates.
|
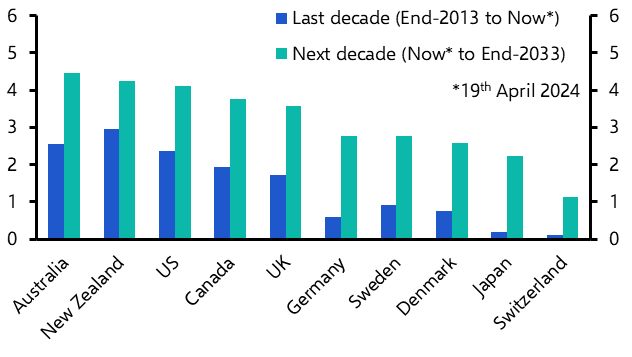
Chart 1: Actual & Projected Average Annual Returns (US Dollars, %) |
|
|
|
Sources: Refinitiv, Bloomberg, Capital Economics. |
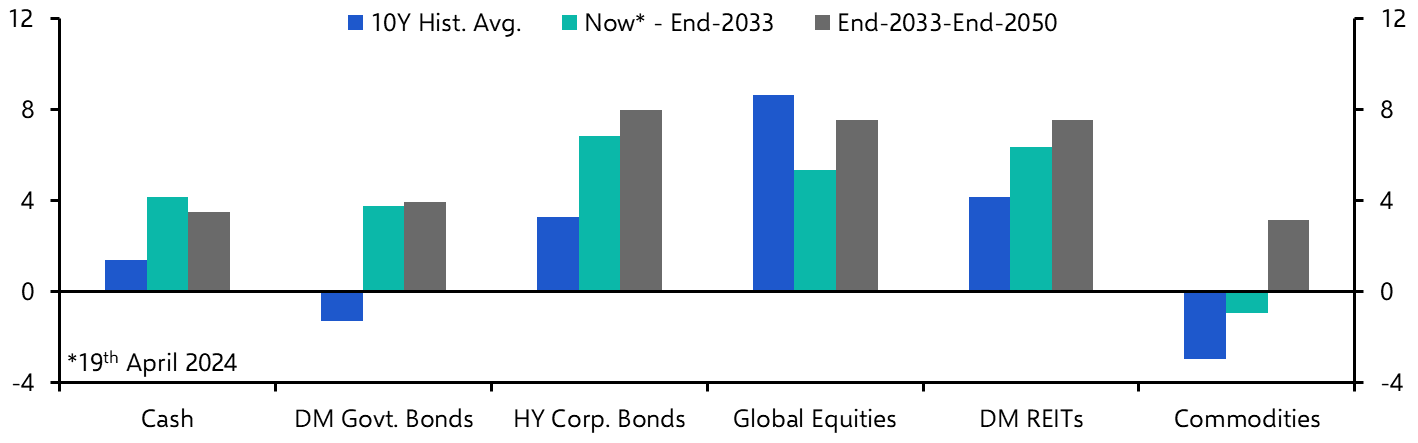
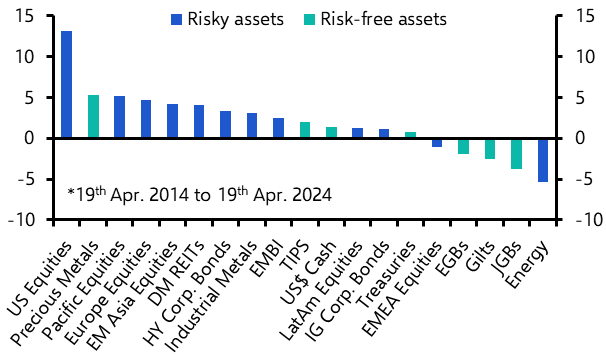
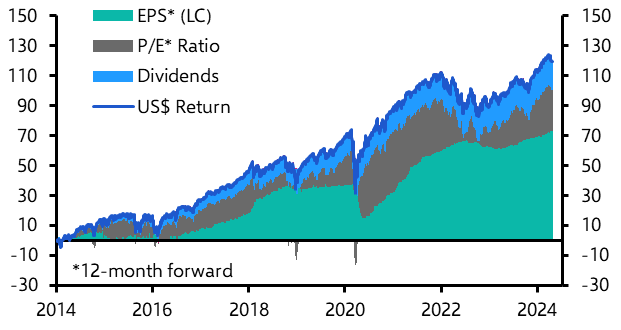
- There are three points to make about asset returns over the past ten years. First, the returns from most government bonds were poor, as bond yields remained roughly around the lows they reached in the wake of the Global Financial Crisis (GFC) up until a couple of years ago. Second, the returns from US equities were very strong, averaging ~13% on an annualised basis, driven primarily by a rise in expected earnings. (See Chart 4.) And third, the returns from other risky assets were rather mixed. While those from developed market (DM) real estate investment trusts (REITs) and some equity markets outside of the US were fairly good, returns from some, such as energy commodities, were poor.
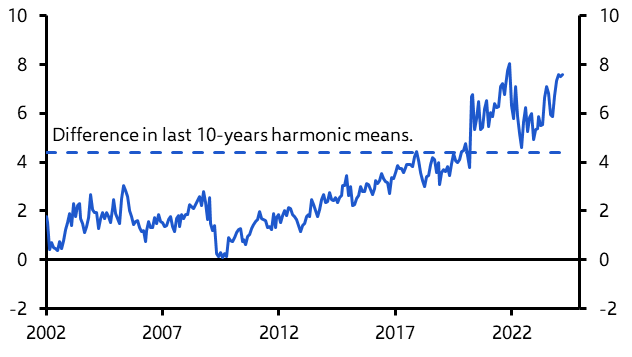
- We think some of those patters will reverse over the next 10 years as some of their underlying drivers change. For example, we expect the average level of DM government bond yields to be significantly higher over the next decade than over the last one (see Chart 5), which would imply considerably more interest income from those bonds.
|
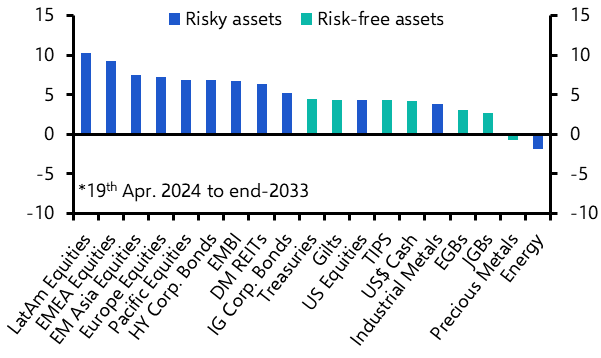
Chart 2: Projected Average Annual Returns* |
Chart 3: Historical Average Annual Returns* |
|
|
|
|
Chart 4: Approximated Contributions To Return From MSCI USA Index (USD, %) |
Chart 5: 10-Year Government Bond Yields (%) |
|
|
|
|
Sources: DKW/KWW, Refinitiv, Shiller, Capital Economics |
- To explore our forecasts for total returns or find our most up-to-date forecasts, see our Long-Run Total Return Forecasts dashboard.
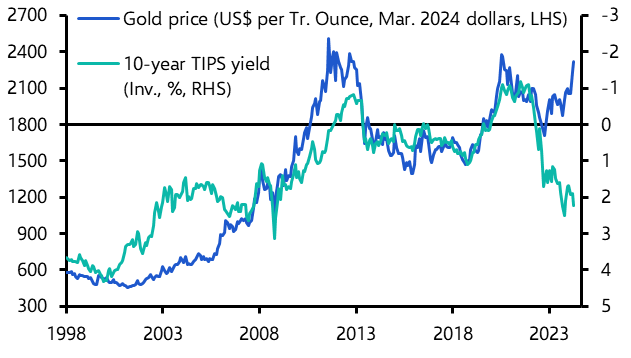
- Furthermore, we expect the valuation gap that has opened up between US equities and those elsewhere to narrow towards its last decade average. (See Chart 6.) Otherwise, we see precious metals going from the best-performing to the worst-performing “safe” asset class as the relationship between real gold prices and their fundamental drivers, which seems to have broken recently, reasserts itself in the coming years. (See Chart 7.)
- The change in drivers of asset returns that we predict hinges largely on our view around the rise of Artificial Intelligence (AI) technology, which we expect to drive a productivity boom with peak impacts felt in the 2030s. For a start, we think the AI-fuelled economic boost will contribute to higher real equilibrium interest rates which will weigh on equity valuations and, paired with higher inflation than in the post-GFC era, will drive bond yields up.
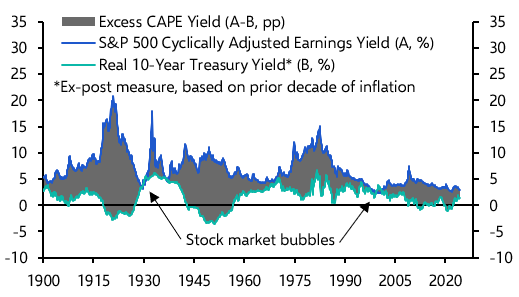
- What’s more, we think that investors looking to crystalise the gains from the economic benefits of AI up front are fuelling a bubble in the US stock market (see here), especially in the case of “big-tech” stocks. We anticipate that this will push that market (and other risky assets) to new highs in the near term. But we suspect that the bubble will ultimately burst beyond the end of next year, causing a correction in valuations. After all, this dynamic played out around both the dot com bubble of the late 1990s and early 2000s and the Great Crash of 1929 (see Chart 8): investors required a progressively smaller CAPE earnings yield (the inverse of Shiller’s CAPE) compared to the real yield of safe assets as the bubbles inflated. And in their aftermath, the opposite occurred, as valuations collapsed.
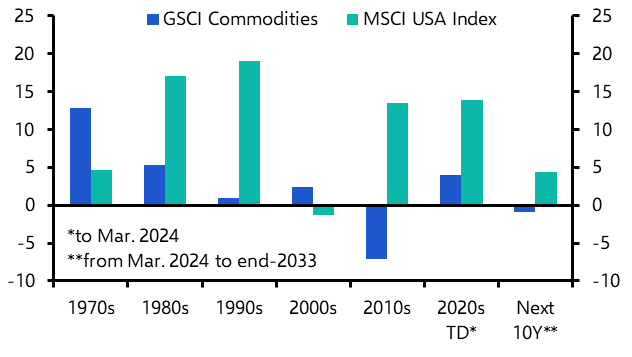
- As far as other risky assets are concerned, we suspect their returns will be fairly in line with those over the past decade. That means we project that the returns from DM REITs will be broadly similar to, albeit a bit stronger than, those of DM equities. Meanwhile, we are less upbeat when it comes to commodities, which would also be in keeping with historical trends, as real returns over longer time horizons have usually been meagre. (See Chart 9.) We think oil will suffer from the transition to green energy and that any resulting boost to industrial metals will be more than offset, in the coming decade at least, by a slowdown in China’s economy.
|
Chart 6: Difference Between 12-Month Forward P/E Ratios Of MSCI USA & MSCI World Ex. USA Indices |
Chart 7: Real Gold Price & 10-Year US TIPS Yield |
|
|
|
|
Chart 8: S&P 500 Cyclically Adjusted Earnings Yield & Components |
Chart 9: Real Annual Average Total Returns From S&P GSCI Commodity Index & MSCI USA Index (%) |
|
|
|
|
Sources: Refinitiv, Shiller, Capital Economics |
Get the full 16-page report for in-depth analysis and long-term returns forecasts across major asset classes, including:
Bonds: Why we expect stronger returns as government bond yields settle at higher levels
Equities: How American exceptionalism may be in the past by the end of this decade
REITs: Why they could deliver solid returns over the coming decades
Commodities: How they may offer poor returns over the coming decades
Get the full long run markets picture
Trial our services to see our complete coverage of long-term financial, commodities and property market returns, including in-depth analysis and comprehensive forecasts to 2050.